Amazon will spend $220 billion in capital expenditure in 2026. The significance of this figure will be clear once you know that it constitutes more than 25% of its trailing sales. It is also roughly 2.6 times what the company spent in 2024.
🔗Magnificent 7 Stocks: Where Investors Are Finding Growth in 2026
Its stock closed at $253.10 on Tuesday, October 27, 12% lower than the 52-week high. The reality is that Amazon is not just a retailer but also has a cloud computing business segment. Nowadays, it designs its own chips and signs power deals, while also building a satellite network.
🔗Amazon Stock Price: Growth Strategies for Investors
The next test for this ambition comes on Thursday, October 29, when Amazon is going to report its third-quarter results. In this article, we will run through the cost of the buildout and the way AWS pays for it. We will also look at what the market already expects from the report.
Where the Amazon Stock Price Stands Before October 29
The shares swung sharply in October. They rose 5% on October 19 after a Morgan Stanley call. They then fell about 4.6% in the October 22 tech sell-off. A modest rebound followed into this week.
Meta Platforms (META) Stock Price Markers & Technical Performance Benchmarks
| Meta Stock Price Marker / Technical Metric | Figure / Market Value |
|---|---|
| Closing Share Price (October 27, 2026) | $253.10 per share |
| Closing Share Price (October 21, 2026) | $262.37 per share |
| 52-Week Trading Range | $196.00 to $287.20 per share |
| Total Market Capitalization | About $2.7 Trillion |
| Trailing P/E Ratio (GuruFocus) | About 20.0x |
| Forward P/E Ratio (GuruFocus) | About 23.5x |
| Q3 2026 Earnings Report Schedule | October 29, 2026 (After Market Close) |
For traders, the $262.37 close before the sell-off and the $287.20 high are the nearest upside references.
Earnings reactions swung hard this year. Trefis notes the stock fell 9.7% over the two days around the February report. It rose 19.8% over the two days around the July report.
A forward multiple above the trailing one tells traders the headline P/E flatters Amazon. The next section explains why.
Trader Takeaway: The AMZN stock price sits mid-range ahead of a report that moved it nearly 20% last time. Volatility, not direction, is the one near-certainty.
From $83 Billion to $220 Billion: The Capex Curve
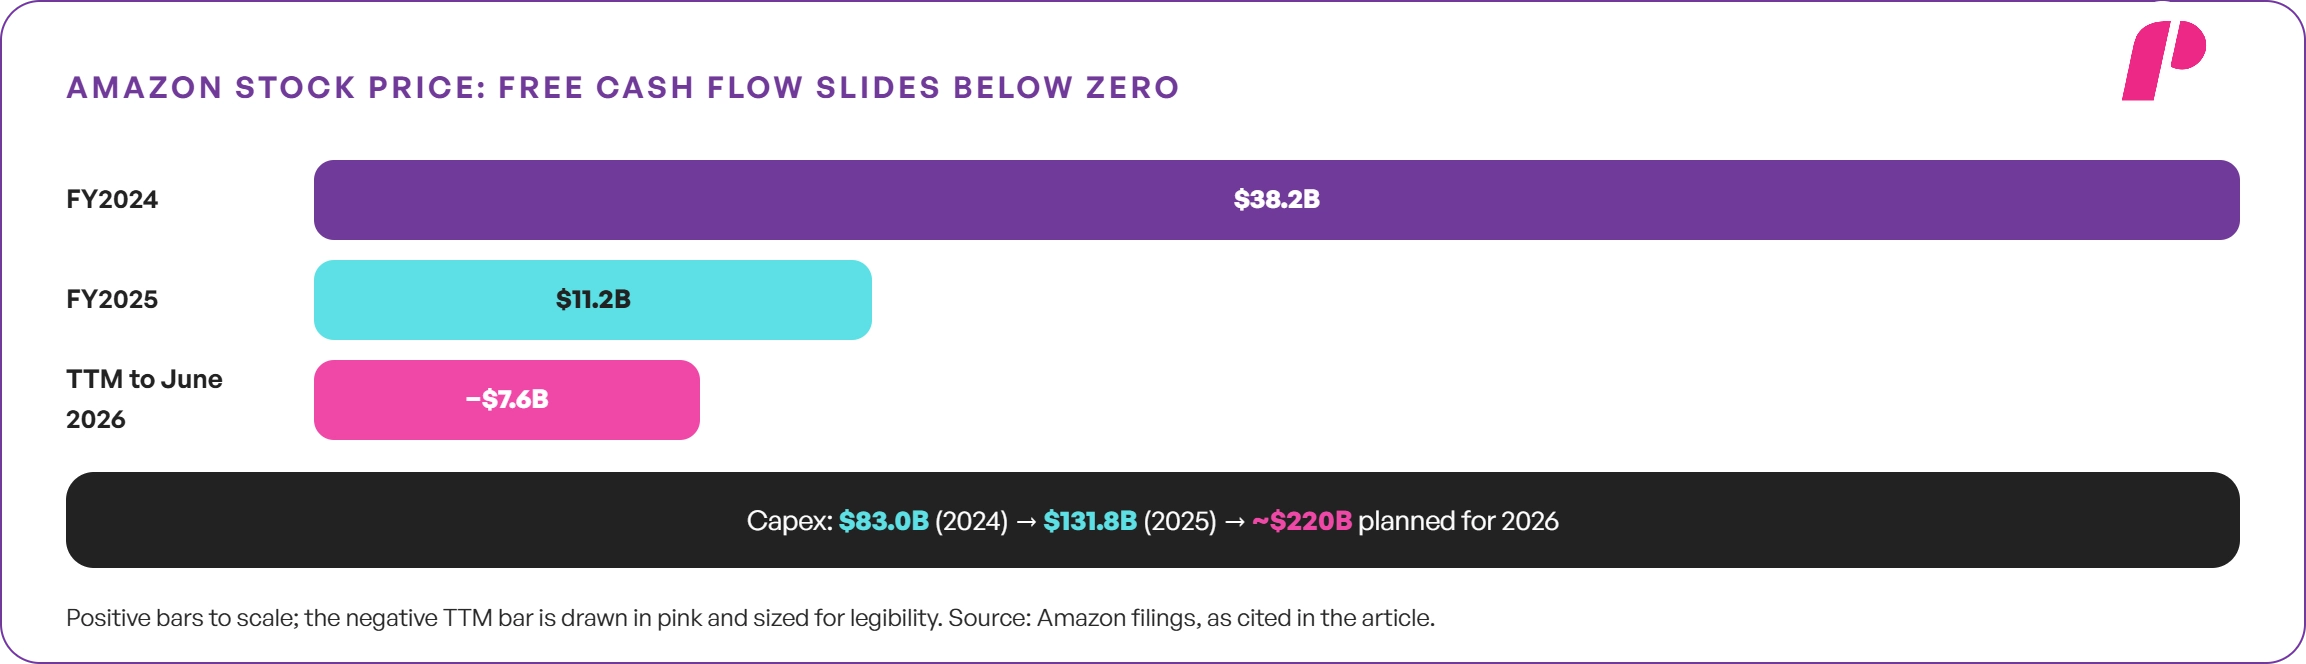
Amazon’s spending has more than doubled in two years. Operating cash flow grew too, but not fast enough.
Amazon.com, Inc. (AMZN) Full-Year Financial Performance & Capital Allocation Metrics
| Annual Financial & Operational Metric | FY2024 Results | FY2025 Results |
|---|---|---|
| Total Net Sales | $638.0 Billion | $716.9 Billion |
| AWS Segment Sales | $107.6 Billion | $128.7 Billion |
| Total Operating Income | $68.6 Billion | $80.0 Billion |
| Net Income Attributable to Shareholders | $59.2 Billion | $77.7 Billion |
| Operating Cash Flow | $115.9 Billion | $139.5 Billion |
| Purchases of Property & Equipment (CapEx) | $83.0 Billion | $131.8 Billion |
| Free Cash Flow Generation | $38.2 Billion | $11.2 Billion |
The squeeze accelerated in 2026. Amazon reports free cash flow on a trailing twelve-month basis, and the trend is stark.
Amazon.com, Inc. (AMZN) Trailing Twelve Months Free Cash Flow & Net Capital Expenditure Trends
| Trailing Twelve Months (TTM) Period Ending | Trailing Free Cash Flow | Capital Expenditures (Net of Incentives) |
|---|---|---|
| December 31, 2025 (FY2025 TTM) | $11.2 Billion | $128.3 Billion |
| March 31, 2026 (Q1 TTM) | $1.2 Billion | $147.3 Billion |
| June 30, 2026 (Q2 TTM) | -$7.6 Billion (Negative TTM FCF) | $169.0 Billion |
In February, management planned about $200 billion of cash capex for 2026. However, in July, it raised the figure to about $220 billion.
As per CEO Andy Jassy, much of this rise has been due to increased costs of memory chips. In addition, this capex amount includes not only AWS but also robotics, semiconductors, and satellites.
The mechanism behind the margin risk works with a lag:

Essentially, the more Amazon spends in the current period, the more it will accumulate in assets. This means that there will be higher depreciation costs for several years to come, while the operating margin will also face challenges in case revenue remains low.
The life cycle of servers and AI processors is much shorter compared to warehouses.
Consequently, the 2026 spending will continue to weigh on reported costs through 2028 and even beyond. Amazon now spends every dollar its operations generate, and then some.
🔗Capex vs Depreciation: How Tech Spending Hits Margins
Trader Takeaway: Free cash flow has turned negative on a trailing basis. For the AMZN stock price, any further capex increase on Thursday would extend that trend into 2027. Therefore, the capex number may matter as much as the revenue line.
AWS Reaccelerates
The spending has a clear purpose, and AWS shows it is working. Growth sped up for five straight quarters, according to Trefis.
Amazon Web Services (AWS) Segment Financial Performance
| AWS Financial & Operational Metric | Q4 2025 Results | Q1 2026 Results | Q2 2026 Results |
|---|---|---|---|
| AWS Segment Net Sales | $35.6 Billion | $37.6 Billion | $42.2 Billion |
| Year-Over-Year Revenue Growth Rate | +24.0% YoY | +28.0% YoY | +36.8% YoY |
| AWS Segment Operating Income | $12.5 Billion | $14.2 Billion | $16.6 Billion |
| AWS Operating Margin* | 35.1% | 37.8% | 39.3% |
*Our Calculation: Segment operating income divided by segment sales.
🔗Microsoft Earnings Reports 2026: Copilot, Nuclear AI & Security
The 37% growth in the second quarter was the fastest pace AWS had seen in 18 quarters. Meanwhile, out of Amazon’s $27.5 billion in operating income, $16.6 billion came from AWS alone. Jassy said Amazon will lack enough capacity to meet demand in 2026 and expects the same in 2027.
Anthropic anchors much of that demand. In April, the AI developer committed more than $100 billion to AWS over ten years.
It can secure up to 5 gigawatts of Trainium capacity. For its part, Amazon agreed to invest $5 billion right away, with up to $20 billion more to follow. This comes in addition to the $8 billion it had already invested earlier.
🔗AI Stocks in 2026: How to Evaluate, Choose, and Trade
Government work adds a second anchor. AWS is one of the four providers on the Pentagon’s Joint Warfighting Cloud Capability contract. The contract has a $9 billion ceiling.
In addition, AWS runs isolated Secret and Top Secret regions that handle classified workloads. Compared with commercial AI demand, these contracts are small; nevertheless, government clients rarely switch providers once they are set up.
As for capacity, AWS is limited by supply rather than by demand, which explains why management keeps raising capex.
Trader Takeaway: Analysts expect AWS growth near 35% on Thursday. A figure below 37% would end the acceleration streak, even if demand stays strong.
Earnings Quality: The Anthropic Effect
Amazon’s reported profits now include large paper gains. Those gains come from marking up its Anthropic stake.
Amazon.com, Inc. (AMZN) Quarterly Financial Performance
| Fiscal Quarter (2026) | Operating Income | Net Income | Anthropic-Related Pre-Tax Gains |
|---|---|---|---|
| Q1 2026 Results | $23.9 Billion | $30.3 Billion | $16.8 Billion |
| Q2 2026 Results | $27.5 Billion | $62.6 Billion | $53.4 Billion (primarily Anthropic) |
In the second quarter, net income was more than double operating income. As a result, diluted EPS climbed to $5.75, compared with $1.68 a year before. This gap in earnings explains why the trailing P/E of about 20 looks cheaper than the forward P/E near 23.5.
🔗Earnings Per Share (EPS) Explained
Consensus for the third quarter sits near $1.96 per share, according to Pepperstone. That estimate assumes no repeat of the second-quarter windfall.
Any new Anthropic markup could swing GAAP EPS far above or below forecasts. Operating income gives the cleaner read.
🔗How to Read an Earnings Report
Trader Takeaway: GAAP EPS has become noisy. Operating income and AWS margins say more about the business than the headline beat or miss. Therefore, an EPS beat driven by gains may not hold in the next session.
Retail and Healthcare: The Rest of the Amazon Stock Price Story
AWS earns most of the profit, but retail still generates most of the sales. Both retail segments improved in 2026.
Amazon.com, Inc. (AMZN) Retail Segment Performance
| Retail Segment & Financial Metric | Q1 2026 Results | Q2 2026 Results |
|---|---|---|
| North America Segment Sales | $104.1 Billion (+12.0% YoY) | $116.2 Billion (+16.0% YoY) |
| North America Segment Operating Income | $8.3 Billion | $9.1 Billion |
| International Segment Sales | $39.8 Billion (+19.0% YoY) | $42.2 Billion (+15.0% YoY) |
| International Segment Operating Income | $1.4 Billion | $1.7 Billion |
North America’s margin reached about 7.8% in the second quarter, by our calculation. International ran near 4%.
🔗Walmart Stock (WMT): Is It the Next Global Tech Monopoly?
Compared with AWS, these margins look thin. However, the retail network is what drives revenue from advertising and Prime subscriptions, as well as from logistics.
Healthcare, on the other hand, is still a small business next to the core, although it keeps growing. Amazon bought PillPack in 2018, which now operates as Amazon Pharmacy. Later, in 2023, it acquired One Medical for about $3.9 billion.
Since neither of these businesses reports its own figures, investors do not have a way to value them yet. Retail funds its own growth today, which leaves AWS cash for the infrastructure race.
Trader Takeaway: Retail margins keep improving, which supports the Amazon stock price. Prime Day timing will distort the third-quarter comparison. Weaker third-quarter retail growth may therefore reflect the calendar rather than demand.
The Custom Silicon Bet
Amazon’s chips are designed by Annapurna Labs, an Israeli startup that the company bought in 2015. One of its products is Nitro, which takes networking, storage, and security tasks away from the host processors. In addition to Nitro, the unit builds the Graviton server CPUs as well as the Trainium AI accelerators.
🔗ARM Earnings Reports: Analyzing Q4 2026 Market Dynamics
Amazon said its chips business passed a $25 billion annualized revenue run rate in the second quarter. It is growing at triple-digit rates. Every Trainium deployed instead of a merchant GPU reduces what Amazon pays $NVDA.
Amazon Web Services (AWS) Custom Silicon Portfolio
| Custom Silicon Chip Line | Primary Core Role & Engineering Function | Direct Industry Competitors & Alternatives |
|---|---|---|
| AWS Nitro System Architecture | Offloads virtualization, storage, and networking operations from host CPU | Traditional software hypervisors, merchant Data Processing Units (DPUs) |
| AWS Graviton Processor Family | Custom Arm-based server CPU designed for high-efficiency cloud computing | Intel and AMD enterprise x86 server processors |
| AWS Trainium Accelerator Series | High-performance AI accelerator built for machine learning training and inference | Nvidia data center GPUs (e.g., H100, Blackwell series) |
The strategy carries two limits. TSMC manufactures Amazon’s advanced chips, which ties AWS to Taiwan.
Nvidia’s CUDA software ecosystem also remains the developer default, so outside customers adopt Trainium more slowly than Anthropic does.
Custom silicon lowers Amazon’s costs, but it does not remove its dependence on one foundry.
🔗Nvidia Stock Analysis: Can NVDA Own AI, Robotics and Quantum?
Trader Takeaway: A $25 billion chips run rate turns an internal cost tool into a business. Its growth rate may matter as much as AWS’s headline number.
Power: From Nuclear Plants to Purchase Agreements
AI data centers need steady electricity, and grid connections can take years. Amazon’s approach has evolved.
In 2024, Amazon bought a data center campus next to Talen Energy’s Susquehanna nuclear plant in Pennsylvania.
Federal regulators then blocked a plan to expand the plant’s direct, co-located supply. In June 2025, the companies restructured the deal into a grid-connected power purchase agreement for 1,920 megawatts through 2042.
Amazon Web Services (AWS) Nuclear Energy Infrastructure Strategy
| Nuclear Power Project / Initiative | Strategic Utility / Technology Partner | Capacity / Scale Details | Current Contract / Project Status |
|---|---|---|---|
| Susquehanna Nuclear PPA | Talen Energy | 1,920 Megawatts (MW) | Fully contracted through 2042 |
| Sullivan County, Indiana SMR Project | American Electric Power (AEP) & X-energy | Up to 960 MW (12 Xe-100 SMR units) | Active exploration; announced October 19, 2026 |
| X-energy Nationwide Collaboration | X-energy | Over 5.0 Gigawatts (GW) by 2039 | Long-term corporate energy transition goal |
The Indiana project would sit on a former coal plant site. Amazon would fund development and buy the power under a long-term agreement.
🔗AI Infrastructure Stocks: Power Players to Watch in 2026
However, there is still no final investment decision. Even though nuclear deals secure future supply, they will not ease the capacity crunch of 2026 and 2027.
Trader Takeaway: Power contracts protect long-run growth. Near-term capacity still depends on conventional grid supply and construction speed. For Thursday’s report, power news is long-term context rather than a price driver.
🔗Nuclear and SMR Stocks Explained
Amazon Leo: The Satellite Bet
Project Kuiper now operates as Amazon Leo. The FCC authorized 3,236 satellites and originally required half in orbit by July 2026.
Launch delays made that impossible. In June, the FCC granted a 24-month extension, moving the halfway milestone to July 30, 2028.
In May, a Blue Origin New Glenn rocket exploded during a ground test before a planned Leo launch.
Amazon confirmed no satellites were aboard. By the second-quarter report, Amazon had nearly 400 satellites in orbit. It expects initial service this year.
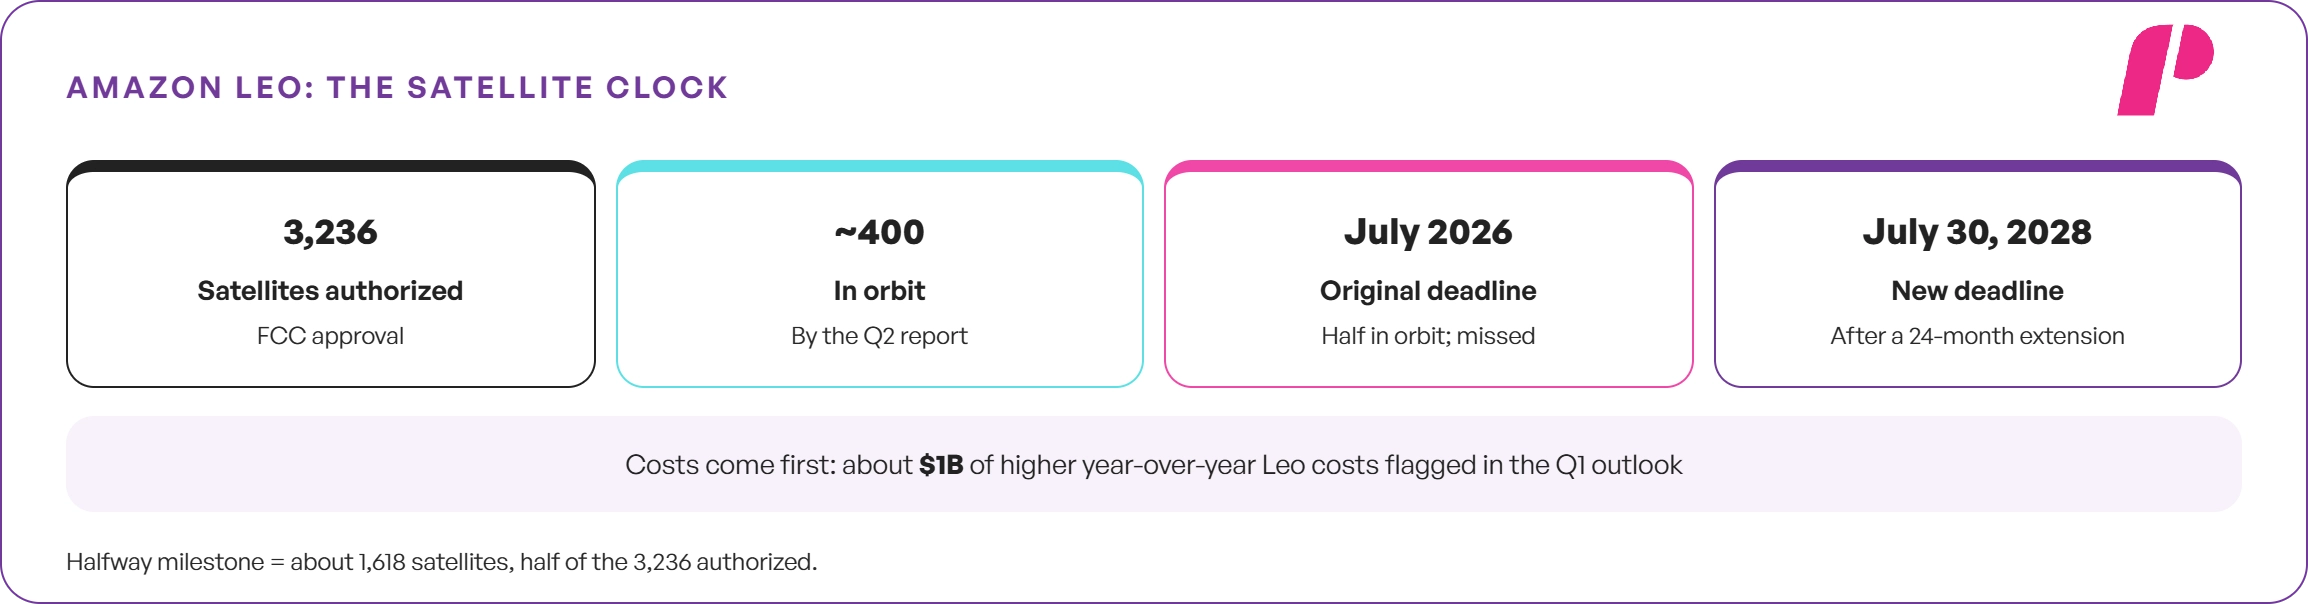
Leo costs money before it earns any. Amazon flagged about $1 billion of higher year-over-year Leo costs in its first-quarter outlook. Leo competes with SpaceX’s Starlink from far behind, and every launch adds to the capex bill.
🔗SpaceX Stock: What Investors Actually Own After the IPO
Trader Takeaway: Leo is a long-dated bet with near-term costs. Service launch timing and pricing remain the key unknowns. For the stock, Leo mostly shows up as a cost line in the outlook.
What Options Imply for October 29
For the third quarter, Amazon expects sales between $197 billion and $202 billion. As for operating income, the company’s guidance ranges from $22.5 billion to $26.5 billion.
Prime Day moved into the second quarter this year, which will weigh on third-quarter retail growth comparisons.
🔗Options Expected Move Explained
Pepperstone reported on October 23 that options implied a move of about 7.4% in either direction. The expected move formula is simple:

For instance, with the stock at $253.10, the calculation is $253.10 × 0.074, which equals about $18.73. This means the implied range goes from roughly $234 up to $272. Live options pricing will differ by Thursday.
Position size can follow the same logic. For example, if a trader has a $100,000 account and risks 1% of it, the amount at risk is $1,000. In case the stop is one expected move away, the position is $1,000 ÷ $18.73, or about 53 shares. This is an illustration, not a trade plan.
🔗Swing Trading Risk Management
Amazon.com, Inc. (AMZN) Earnings Scenario Planning & Stock Price Action Triggers
| Market Scenario | AWS Growth Trigger | CapEx Guidance Signal | Likely Price Reaction |
|---|---|---|---|
| Bullish Scenario | AWS revenue growth printing at 37.0% or higher year-over-year | Full-year 2026 capital expenditure plan held steady near $220.0 Billion | Upside move toward the top of the trading range |
| Base Case Scenario | AWS growth tracking between 33.0% and 36.0% | Modest upward adjustment in infrastructure spending outlook | Muted reaction, hovering near current technical levels |
| Bearish Scenario | AWS growth decelerating below 33.0% | Another large increase in full-year capital expenditure guidance | Downside break below established support range |
These thresholds reflect our judgment, not company guidance. AWS growth and the capex message will likely drive the reaction more than retail results.
Trader Takeaway: Options price a large move. The direction depends on whether AWS growth outruns another capex increase.
The Risks That Matter for the Amazon Stock Price
Each risk below can surface in Thursday’s numbers or on the earnings call.
- Negative Free Cash Flow. Trailing twelve-month FCF reached -$7.6 billion in June.
- Capex Creep. The 2026 plan already rose from $200 billion to $220 billion.
- Earnings Noise. Anthropic gains distort GAAP EPS in both directions.
- Customer Concentration. Anthropic anchors a large share of new AWS demand.
- Foundry Dependence. TSMC builds Amazon’s custom chips.
- Satellite Execution. Leo trails Starlink and faces launch risk.
- Retail Timing. Prime Day’s move to Q2 weighs on Q3 comparisons.
🔗Risk Management in Stocks: A Complete Guide 2026
Closing Thoughts
Amazon has turned itself into an infrastructure company. It designs chips, contracts nuclear power, and launches satellites while running the world’s largest cloud. AWS’s growth of 37% shows that the spending can pay off.
The cost is visible in the cash flow statement. Free cash flow went from $38 billion in 2024 to negative territory in 2026.
The Amazon stock price now depends on whether AWS growth can outrun a capex bill that keeps rising. In our view, AWS demand justifies much of the buildout.
Satellites and power, however, add costs that will take years to repay. Thursday’s report will show whether 2027 brings relief or another step up in spending.
NFA. DYOR. This analysis is for informational purposes only and is not investment advice.
If you liked this post make sure to share it!