Earnings season floods traders and investors with fast-moving headlines every quarter. Learning how to read an earnings report cuts through that noise before a single trade gets placed. Many people hold positions or plan trades without a clear process to read an earnings report when these releases hit.
They lean on social media snippets or breaking-news alerts instead of the actual filing. As a result, they often overreact to a single headline number and misjudge the real signal. However, a structured approach to reading the report changes that outcome completely.
“Accounting is the language of business.”
This guide answers a practical question every trader eventually asks. How do you read an earnings report before deciding to buy, hold, or trade? Therefore, the sections below cover report basics, key numbers, price reaction, strategy, and prop-firm risk rules. The guide works as how to read an earnings report for beginners while still adding depth for active traders.
What You Will Learn in This Guide
-
- How To Read An Earnings Report And Its Core Sections
- How To Interpret Revenue, Eps, Margins, And Cash Flow Together
- Why Stocks Sometimes Drop After Strong Earnings And Rise After Weak Ones
- How Traders And Prop-Firm Candidates Use Earnings Reports In Real Strategies

How to Read an Earnings Report: What It Is and Why It Matters
Definition: A quarterly earnings report is a structured filing that summarizes a company’s performance — covering revenue, expenses, profit, cash flow, and management commentary for a single period.
Public companies file this report as a 10-Q each quarter, then a fuller 10-K annually. Learning how to read an earnings report starts with this basic four-part structure. That structure applies equally to a first-time reader and a seasoned trader.
How do you read an earnings report for a stock in practice? You start with the company overview and headline results, then move into the financial statements. Meanwhile, you finish with management discussion, which explains context the raw numbers cannot capture alone.
Traders and investors both rely on this structure for different reasons. For example, an investor may focus on long-term trends across many quarters. In contrast, a trader often cares most about the immediate surprise versus expectations.
Core Sections of a Quarterly Earnings Report (Income Statement, Balance Sheet, Cash Flow, Commentary)
Every earnings report contains four core sections that repeat each quarter. The income statement shows revenue, expenses, and net income for the period. The balance sheet shows assets, liabilities, and shareholder equity as of that date.
The cash flow statement separates operating, investing, and financing activity into three categories. This section shows whether reported profit actually converts into real cash. Furthermore, management discussion adds context around one-time items, competitive pressure, and forward plans.
What should I look for in a quarterly earnings report at first glance? Start with revenue and net income trends, then check cash flow against reported profit. Therefore, a quick scan of all four sections beats fixating on one number alone.
How Often Companies File an Earnings Report: 10-Q, 10-K, and Annual Filings
Public companies file a 10-Q with regulators three times during each fiscal year. This filing covers one quarter and includes unaudited financial statements plus commentary. However, the fourth quarter rolls into a more detailed annual filing instead.
🔗 10-Q Filing
The 10-K arrives once per year and includes audited financial statements. It also adds deeper risk disclosures, business segment detail, and executive discussion of strategy. As a result, the 10-K often reveals context that quarterly filings compress or omit.
A quarterly earnings report differs from these full financial statements in scope. The report acts as a fast snapshot released alongside a press release and call. Meanwhile, the full 10-Q or 10-K filing follows within days and offers deeper, more detailed disclosure.
The Key Numbers in an Earnings Report: Revenue, EPS, Margins and Cash Flow
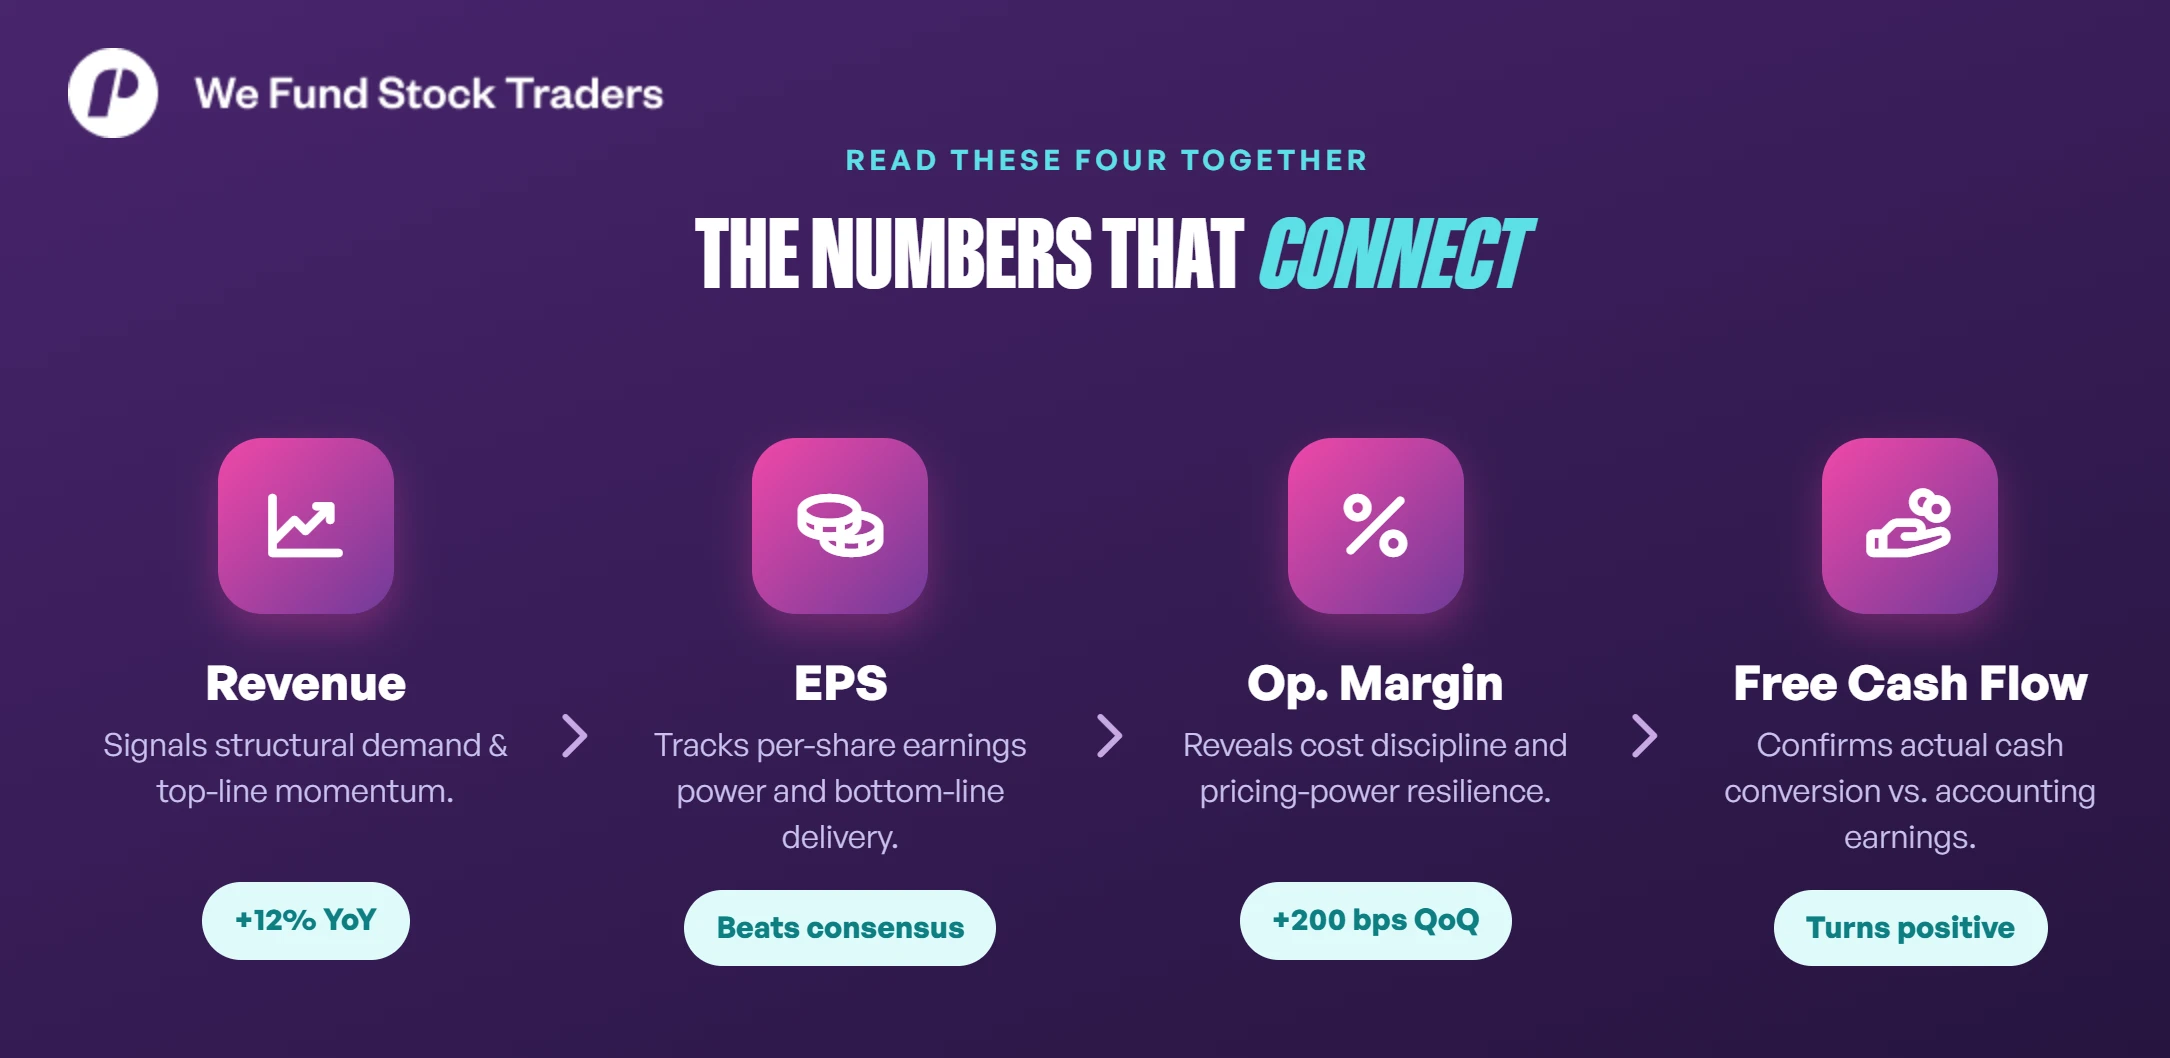
Reading an earnings report well starts with four connected figures every time. Revenue shows demand, EPS shows profitability per share, and margins show efficiency. Cash flow then confirms whether that reported profit reflects real, collectible cash.
How do you read EPS and revenue in an earnings report together? Compare both figures to the same quarter last year and to consensus estimates. Furthermore, rising revenue paired with flat or falling EPS often signals margin pressure underneath.
🔗 Earnings Per Share
Revenue trends reveal whether demand for a company’s products is growing or shrinking. For example, steady multi-quarter growth often signals durable business momentum rather than a one-time spike. In contrast, a single strong quarter after several weak ones deserves closer scrutiny.
How to Read Revenue and EPS Together in an Earnings Report
Revenue and EPS answer two different questions about the same business. Revenue measures total sales, while EPS measures profit divided across outstanding shares. Reading them together shows whether growth actually strengthens per-share profitability.
What is considered a good earnings report for investors in this context? A good report shows revenue and EPS growth that beats or meets expectations. Therefore, both figures should move in the same direction across several consecutive quarters.
A company can grow revenue while EPS shrinks from rising costs or share dilution. However, that combination often signals weaker earnings quality than the headline suggests. Meanwhile, EPS growth built on buybacks alone, without revenue growth, deserves similar caution.

Understanding Margin and Cash Flow Trends in an Earnings Report Beyond the Headline EPS
Margins reveal how efficiently a company turns revenue into actual profit. Gross margin reflects pricing power after direct production costs are removed. Operating margin then reflects core efficiency before financing costs and taxes apply.
Margin direction across several quarters often matters more than one quarter’s headline EPS. For example, improving margins can signal better pricing power or tighter cost control. In contrast, shrinking margins alongside rising revenue may signal growing competitive pressure.
Operating cash flow and free cash flow round out the earnings quality picture. Free cash flow subtracts capital spending from operating cash flow for a cleaner figure. As a result, a widening gap between net income and free cash flow deserves attention.
🔗 Free Cash Flow
Key Earnings Report Metrics at a Glance
| Metric | Operational Definition | Trader / Investor Significance | Sample Earnings Signal |
|---|---|---|---|
| Revenue | Total sales generated | Signals structural demand and top-line momentum | +12% YoY growth |
| EPS | Net income per share | Tracks per-share earnings power and bottom-line delivery | Beats consensus despite flat sales |
| Operating Margin | Core operational efficiency | Reveals cost discipline and pricing power resilience | Expands 200 bps QoQ |
| Free Cash Flow | Operating cash minus CAPEX | Confirms actual cash conversion vs. accounting earnings | Reverts to positive burn-rate turnaround |
Example figures are illustrative, not drawn from a specific company filing.
Expectations, Guidance and How an Earnings Report Moves Stock Prices
How do earnings reports affect stock prices in practice? Price reactions depend on how actual results compare to expectations and guidance. Therefore, the link between earnings reports and stock price rarely reduces to one single reported number.
Do stocks usually go up or down after earnings reports overall? There is no guaranteed direction, since reactions depend on surprise and prior positioning. Meanwhile, a company can report strong growth and still see shares fall sharply.
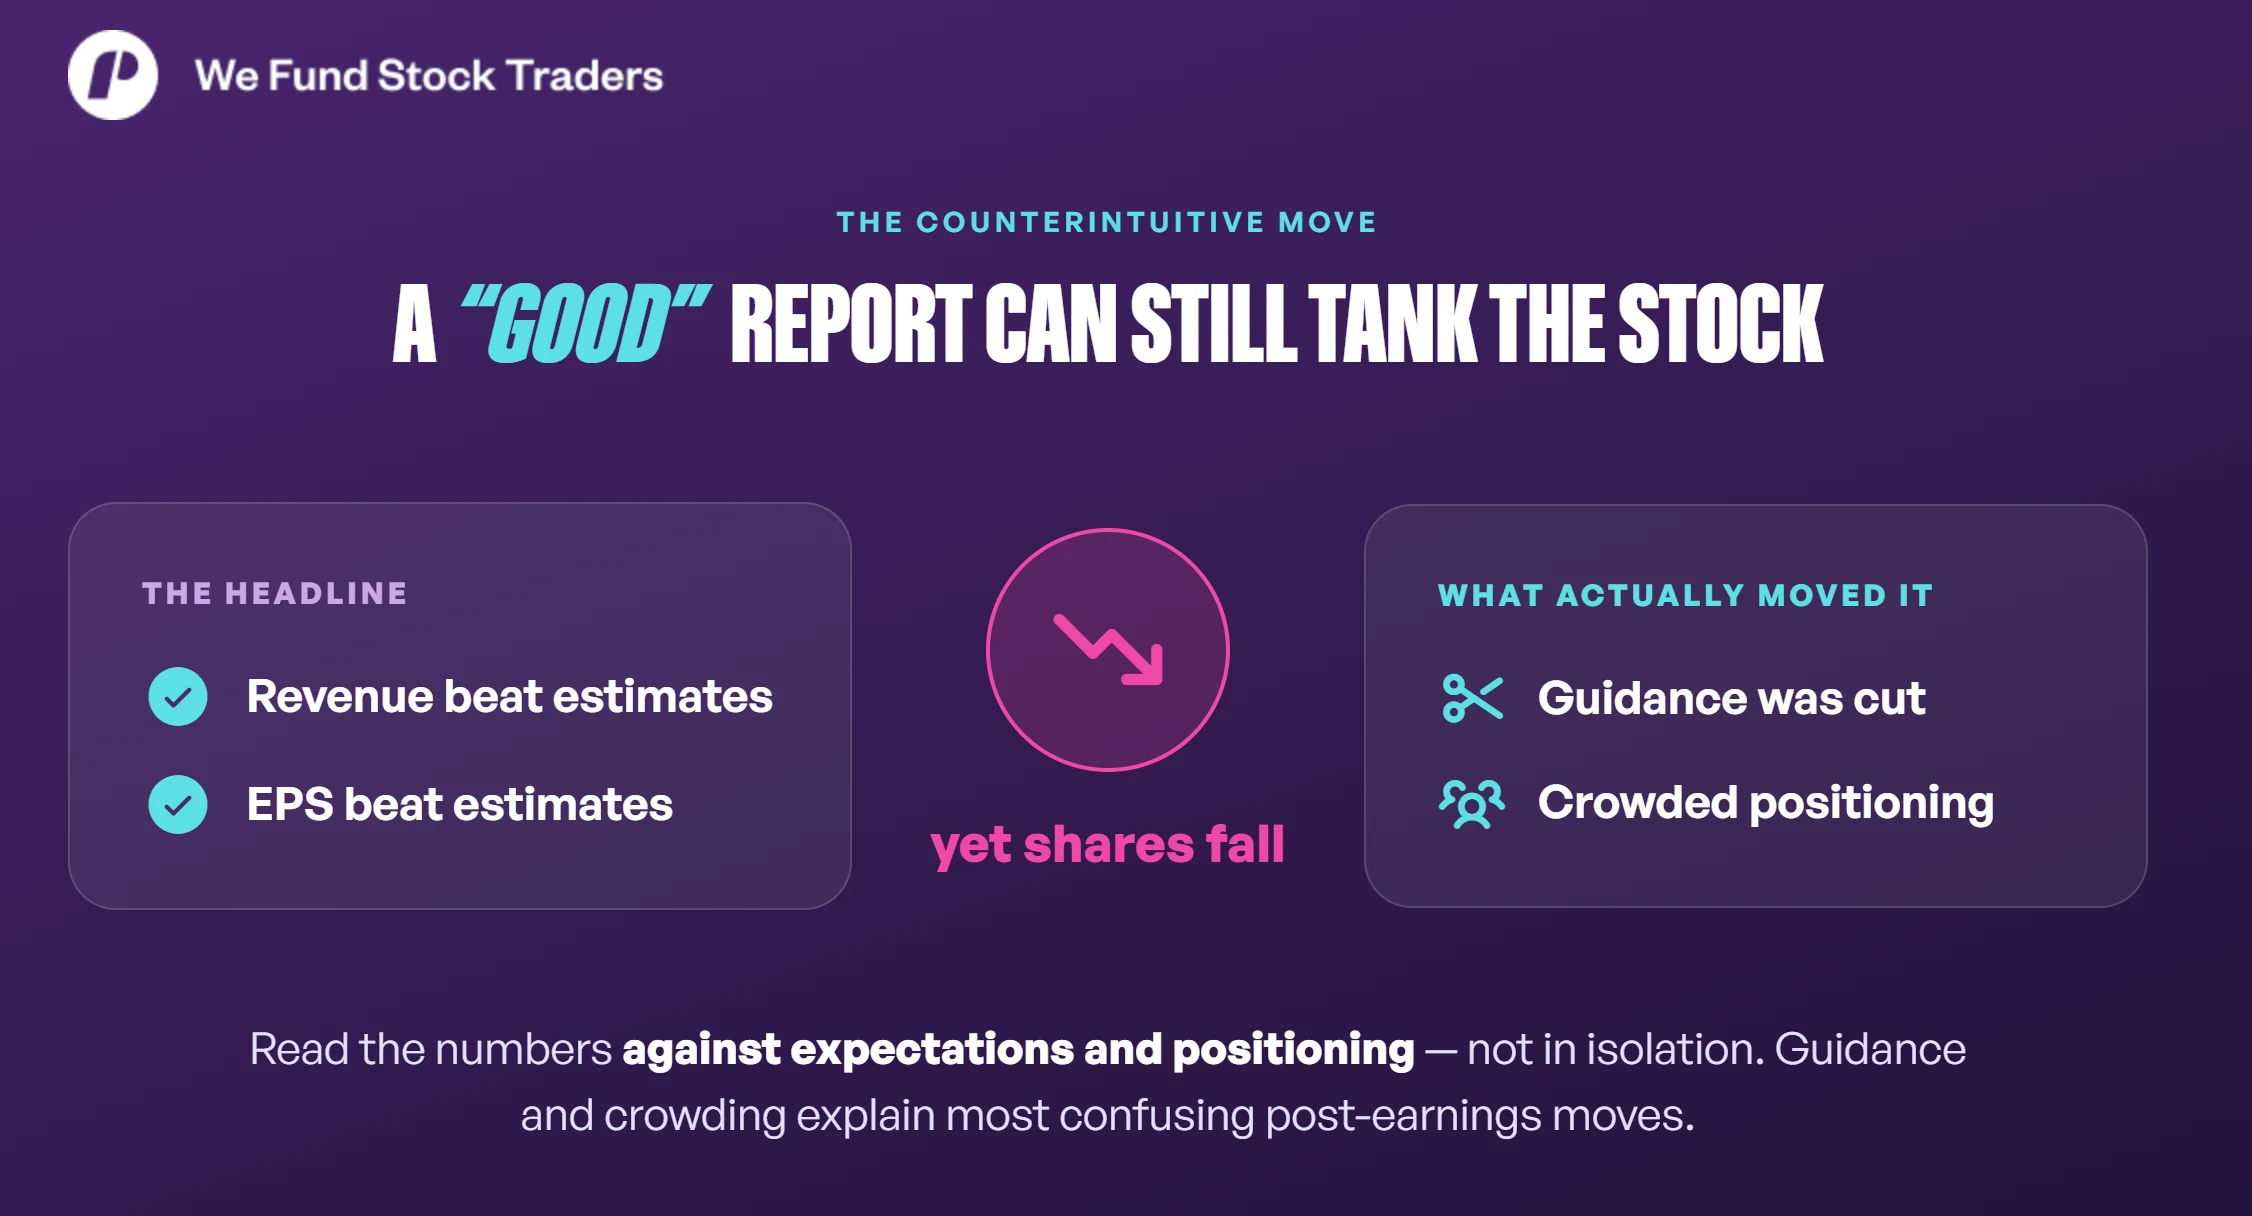
Why can a stock drop even after a good earnings report on the surface? A beat on revenue and EPS can still disappoint if guidance gets cut. For example, crowded positioning before the release can also amplify a disappointing reaction.
“It’s not earnings changes that cause stock price changes, but earnings changes that come as a surprise.”
Beats, Misses and Surprises: How to Read an Earnings Report Against Expectations
Analysts publish consensus estimates for revenue and EPS before every earnings release. How do I know if a company beat or missed earnings expectations clearly? Compare reported figures directly against that published consensus, not against last year alone.
A beat means results exceeded consensus estimates, while a miss means results fell short. Some traders also track whisper numbers, which reflect informal expectations among active market participants. However, official consensus estimates remain the most reliable public benchmark for comparison.
Surprise size matters as much as direction when reading the initial reaction. A narrow beat rarely moves a stock much beyond normal daily volatility. In contrast, a large surprise in either direction often triggers a sharper, faster price move.
“Wall Street tends to overreact when it gets worried about earnings.”
Why Stocks Drop After a “Good” Earnings Report and Rise on “Bad” Ones
Guidance often carries more weight than the quarter that already closed. Management provides forward expectations for revenue, margins, or earnings in coming quarters. Furthermore, an earnings report guidance cut can outweigh a strong headline beat entirely.
Positioning also shapes the reaction beyond the numbers themselves. For example, heavily crowded long positions can trigger selling even after solid results. Meanwhile, a stock priced for disappointment can rally on results that merely meet expectations.
Reading numbers alongside expectations and positioning explains most confusing post-earnings moves. As a result, traders who only check the headline beat or miss risk misreading the reaction. Therefore, guidance and positioning deserve equal weight alongside the reported figures.

Using Earnings Reports to Plan Trades Around Earnings Season
How can traders use earnings reports to find trading opportunities responsibly? Reports help identify volatility, trend changes, and catalysts for entries and exits. However, an earnings report trading strategy only works with a clear plan beforehand.
How to read earnings reports for day trading differs from a longer swing approach. Day traders react within minutes to the headline numbers and initial price move. In contrast, swing traders often wait for the first reaction to settle before positioning.
How to use earnings reports for trading starts well before the release itself. Traders build scenarios around possible outcomes and size positions to match each one. Furthermore, every scenario should respect account risk limits set in advance.
Scenario Planning Before the Earnings Report for Traders and Prop-Firm Candidates
Scenario planning starts with checking the earnings calendar for the release date and time. Traders then review past reactions to prior earnings releases from the same company. For example, a history of large post-earnings gaps signals higher expected volatility ahead.
🔗Earnings Calendar
Implied volatility from options pricing offers another useful input before the release. This figure reflects the market’s expected price swing around the announcement. Meanwhile, comparing implied volatility against historical actual moves highlights whether options look expensive or cheap.
🔗 Implied Volatility
Traders then map three broad outcomes: a strong beat, an in-line result, and a miss. Each outcome pairs with a planned reaction and a maximum acceptable position size. Therefore, the plan exists before the numbers hit the screen, not after.
Trading Setups After the Earnings Report: Day Trading, Swing Trading and Longer Holds
Continuation setups follow a strong initial move that confirms the trend with volume. Traders watch for a clean break of the pre-earnings range on rising volume. However, thin volume behind the move often signals a fade rather than genuine follow-through.
Mean-reversion setups appear when the initial reaction overshoots the actual news. For example, a sharp drop despite solid guidance can attract buyers within a session or two. In contrast, a spike on thin justification often fades within the following days.
Longer-term holds use the report to confirm or challenge an existing investment thesis. A single quarter rarely changes a multi-year view on its own. As a result, longer-term investors weigh the report against several prior quarters before acting.
Basic earnings-season workflow for traders:
- Pre-Earnings: Check the calendar, past reactions, implied volatility, and possible outcomes
- Earnings-Day: Read the release quickly against estimates, then watch the initial reaction
- Post-Earnings: Apply continuation or mean-reversion setups only within preset risk limits
Prop Trading Perspective: Reading the Earnings Report, Calls, Transcripts and Risk Management
Reading the written report without the earnings call misses meaningful context. Executives explain unusual items, competitive pressure, and forward plans during this scheduled call. Furthermore, analyst questions on the call often expose details the prepared remarks leave out.
“Successful investing [and trading] is about managing risk, not avoiding it.”
Earnings reports and prop trading risk management connect directly around every release. Prop firms enforce daily loss limits and overall drawdown rules on funded accounts. Therefore, one oversized position during an earnings gap can end a funded account quickly.
🔗 Funded Account
How can prop traders use earnings reports without breaking risk rules? They reduce position size, avoid certain high-risk names, or trade only predefined scenarios. Meanwhile, some prop traders choose to step aside entirely during the most volatile releases.
How to Read an Earnings Call Transcript Alongside the Earnings Report
The transcript pairs numbers from the written report with management’s spoken context. Tone, hedging language, and answers to tough analyst questions all carry signal. For example, a defensive answer about margins often hints at pressure the report understates.
Reading both documents together surfaces risks that neither one reveals alone. The report shows what happened, while the call often explains why it happened. However, skipping the call risks missing guidance nuance buried in a single spoken sentence.
Traders who read both documents build a fuller picture before sizing any trade. This combined read takes only a few extra minutes beyond the headline numbers. As a result, it meaningfully lowers the odds of a misread reaction.
Using Earnings Reports Without Breaking Prop Firm Risk and Drawdown Rules
Prop firm rules exist to protect both the trader and the funding provider. Daily loss caps, maximum drawdown limits, and consistency rules all apply around earnings. Furthermore, a single volatile gap can breach several of these rules at once.
🔗 Position Sizing
Reduced position size during earnings season protects funded accounts from outsized single-day losses. For example, a trader might cut normal size in half before a volatile release. In contrast, some prop traders avoid trading the name entirely until the reaction settles.
Stepping aside during an earnings release is sometimes the most disciplined available choice. This decision protects the account when no scenario fits within acceptable risk limits. Therefore, patience around earnings often matters as much as any single trade idea.
Long-Term Investors vs Short-Term Traders: Different Ways to Read an Earnings Report
The same earnings report serves long-term investors and short-term traders in different ways. Are earnings reports useful for long-term investors or only short-term traders in practice? Both groups rely on the same filing, but they weigh different sections.
Long-term investors focus on multi-year trends across revenue, margins, and cash flow. Meanwhile, short-term traders focus on the immediate surprise, volatility, and liquidity around the release. However, both approaches start from the same core financial statements.
“In the short run, the stock market is a voting machine; in the long run, it is a weighing machine.”
Evaluating companies when buying stock for the long run requires patience across many quarters. As a result, one disappointing release rarely overturns a well-supported long-term thesis on its own. Therefore, context across several reports matters more than any single release.
How Long-Term Investors Use an Earnings Report to Judge Quality and Growth Durability
Long-term investors track revenue growth, margin trends, and debt levels across many years. They also examine free cash flow to judge whether growth relies on genuine cash generation. For example, growth funded by rising debt deserves closer scrutiny than organic expansion.
Growth durability matters more to this group than one quarter’s headline surprise. However, a consistent pattern of guidance cuts across several quarters can signal a weakening business. Meanwhile, steady execution against management’s own targets supports confidence in the underlying thesis.
This longer view treats each earnings report as one data point among many. Therefore, long-term investors update their thesis gradually rather than reacting to any single print. As a result, their trading activity around earnings tends to stay limited.
How Short-Term Traders Read an Earnings Report for Volatility and Reaction Patterns
Short-term traders care most about volatility, liquidity, and the pattern of the initial reaction. High implied volatility signals a larger expected move and a wider range of outcomes. Furthermore, thin liquidity around the release can widen spreads and increase execution risk.
Reaction patterns from prior quarters offer a useful, though imperfect, guide for expectations. For example, a stock with a history of fading initial gaps may behave similarly again. In contrast, a stock known for strong follow-through may reward patience after the open.
These traders size positions around that expected volatility rather than long-term valuation. Therefore, their earnings-season decisions center on risk per trade and account limits. Meanwhile, they treat each release as an independent, self-contained event rather than a single narrative.
Using Earnings Reports as a Consistent Decision Tool
An earnings report gives traders and investors a structured view of company performance. It combines revenue, EPS, margins, cash flow, and forward guidance into one scheduled release. This structure repeats every quarter, which makes it possible to build a genuinely repeatable process to read an earnings report the same way each time.
Read an Earnings Report the Same Way Every Quarter
For example, comparing the same four or five figures each quarter builds pattern recognition over time. However, that pattern recognition only develops if the reader follows a consistent structure release after release. Therefore, reading the report the same way every time matters more than any single insight.
This structured view supports very different decisions depending on the reader’s goals. A long-term investor uses it to judge growth durability across many years. Meanwhile, a short-term trader uses the same filing to judge volatility and immediate risk.
Common Earnings Season Mistakes to Avoid
Understanding these pieces together helps traders avoid common, costly mistakes each earnings season. Overreacting to one headline number remains one of the most frequent errors among newer traders. Ignoring guidance or skipping the earnings call removes crucial forward-looking context from the decision.
Furthermore, ignoring prop-firm drawdown rules during a volatile release can end a funded account fast. A single oversized position during an earnings gap can breach several account rules at once. As a result, risk rules deserve the same attention as the reported numbers themselves.
Separate the Reading Process From the Trade
In contrast, traders who separate the reading process from the trading decision tend to fare better. They read the full report first, then apply risk rules before sizing any position. Therefore, that separation reduces impulsive decisions made in the first volatile minutes after a release.
Combining report reading with a simple checklist changes how earnings season actually feels. Clear pre-earnings, earnings-day, and post-earnings rules replace guesswork with a repeatable routine. This routine works whether the reader manages a personal account or a funded prop account.
For example, the same checklist can flag whether a setup fits predefined risk limits before entry. However, no checklist removes uncertainty completely, since price reactions always carry some unpredictable element. Therefore, the goal remains better decisions on average, not a guaranteed outcome on any single trade.
Turn Earnings Season Into a Lasting Habit
As a result, earnings season becomes a structured part of the process rather than a stressful surprise. Meanwhile, the discipline built around one earnings season tends to carry over into the next. That consistency, repeated across many quarters, becomes the real long-term advantage.
Readers can build a personal earnings-report checklist from the steps covered in this guide. Therefore, apply that checklist to the next company on your watchlist before you buy, hold, or trade. A consistent process, repeated every quarter, becomes a durable trading and investing habit.
If you liked this post make sure to share it!