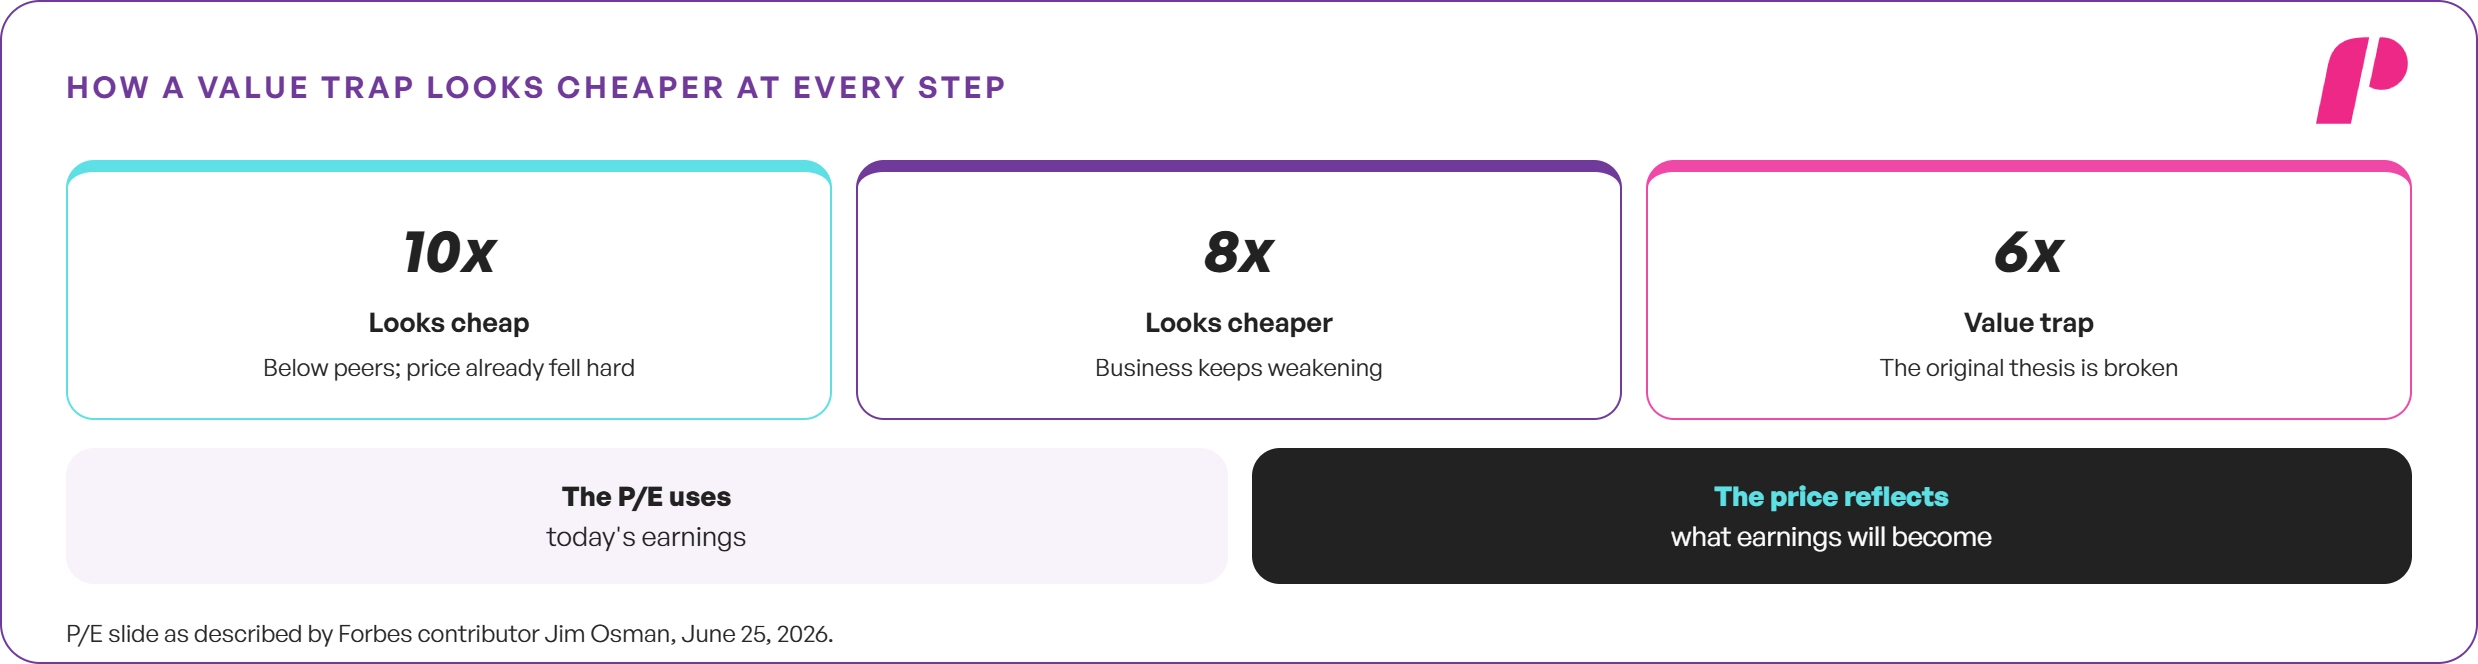
A value trap often starts as a stock that looks like an obvious bargain on a trader’s screen. Its P/E sits at 10, well below its peers, and the price has already fallen hard.
However, a few months later the same stock trades at 8 times earnings, then 6. Forbes contributor Jim Osman described this exact 10x to 8x to 6x slide on June 25, 2026.
His warning: each step looks like a better deal while the business, and the original thesis, keep weakening. As a result, a trader who buys on the low multiple alone has walked into a value trap.
Meanwhile, the urge to buy more at each lower price makes every new drop more expensive. On a funded stock account, that habit can trigger a daily loss limit long before any recovery.
Therefore, the first job is to learn why the market priced the stock so low. Many traders reach this point while holding a cheap stock that keeps refusing to recover.

Identifying And Managing Value Traps
Sooner or later the question arrives: “How can a trader know if a stock is a value trap?” The answer starts with why the stock got cheap and ends with a stop set before buying.
Four things decide whether a beaten-down stock is fading or misjudged: earnings, debt, competition, and catalysts. Next come the warning signs, three common trap types, and the growth trap in expensive stocks.
In addition, numbers that have been worked out demonstrate how both a low P/E ratio and a high dividend yield can prove misleading for the purchaser.
This brings us to the last component, which applies all these considerations to funded accounts and illustrates how purchasing weakness may violate the restrictions.
There is no checklist that can determine the bottom in a declining stock, and many well-informed buyers are often caught by this trap.
What This Guide Covers:
- Why a low P/E stock can keep falling
- Six factors that separate a setback from a decline
- How a falling price inflates a dividend yield
- What GMO found about growth traps through July 2021
- Why a second purchase can turn a $2,000 loss into $3,000
What Is a Value Trap?
Value Trap Definition
A value trap is a stock that looks cheap by traditional measures yet continues to decline as the business deteriorates. Screens typically rely upon price-to-earnings and price-to-book values, where price is measured against profit and net assets.
A retailer at 8 times earnings next to rivals near 20 looks like an easy discount. The search “what is a value trap in stocks example” usually points to this kind of gap.
However, the multiple rests on today’s earnings, while the price reflects what earnings will become. Value traps form when investors expect profits to keep sliding, so they won’t pay the usual multiple.
🔗 Valuation Ratios: How to Tell If a Stock Is Cheap or Expensive
Why Cheap Stocks Can Stay Cheap
Meanwhile, academic research adds a layer to the value trap that beginners rarely consider. Stephen Penman and Francesco Reggiani argued in September 2014 that buying value means buying risky growth.
In their sample, cheap stocks carried shakier growth expectations, and low accounting returns warned of that risk early. Sorting them apart requires overlooking the ratio itself to focus on the company behind it.
Value Trap Vs Undervalued Stock: How To Tell The Difference
Temporary Problem Or Permanent Decline
The distinction between a bargain and a trap usually lies in one question – why is the stock under-valued? Undervalued stocks have problems that are temporary in nature, such as a bad quarter or even a market-wide crash. While traps face businesses where the market is declining, and it is very hard for this trend to reverse.
Equity Analysis & Valuation Framework
| Evaluation Factor & Metric | Undervalued Stock (Opportunity) | Value Trap (Structural Risk) |
|---|---|---|
| Reason for Low Share Price | Temporary market setback or short-term sector selloff | Structural, lasting decline in the underlying business model |
| Underlying Earnings Trend | Stable baseline or actively recovering profitability | Falling consistently across several consecutive quarters |
| Balance Sheet & Debt Load | Manageable leverage and adequate liquidity reserves | Rising debt burden where interest expense consumes operating cash |
| Competitive Market Position | Intact economic moat and brand equity | Losing market share, customers, or long-term industry relevance |
| Operational or Strategic Catalyst | New leadership (CEO), business spinoff, or active share buyback | None in sight; lack of clear turnaround drivers |
| Price Action & Technical Trend | Base-building; stops making new cyclical lows | Persistent downward momentum; continually makes new lows |
Why A Catalyst Matters
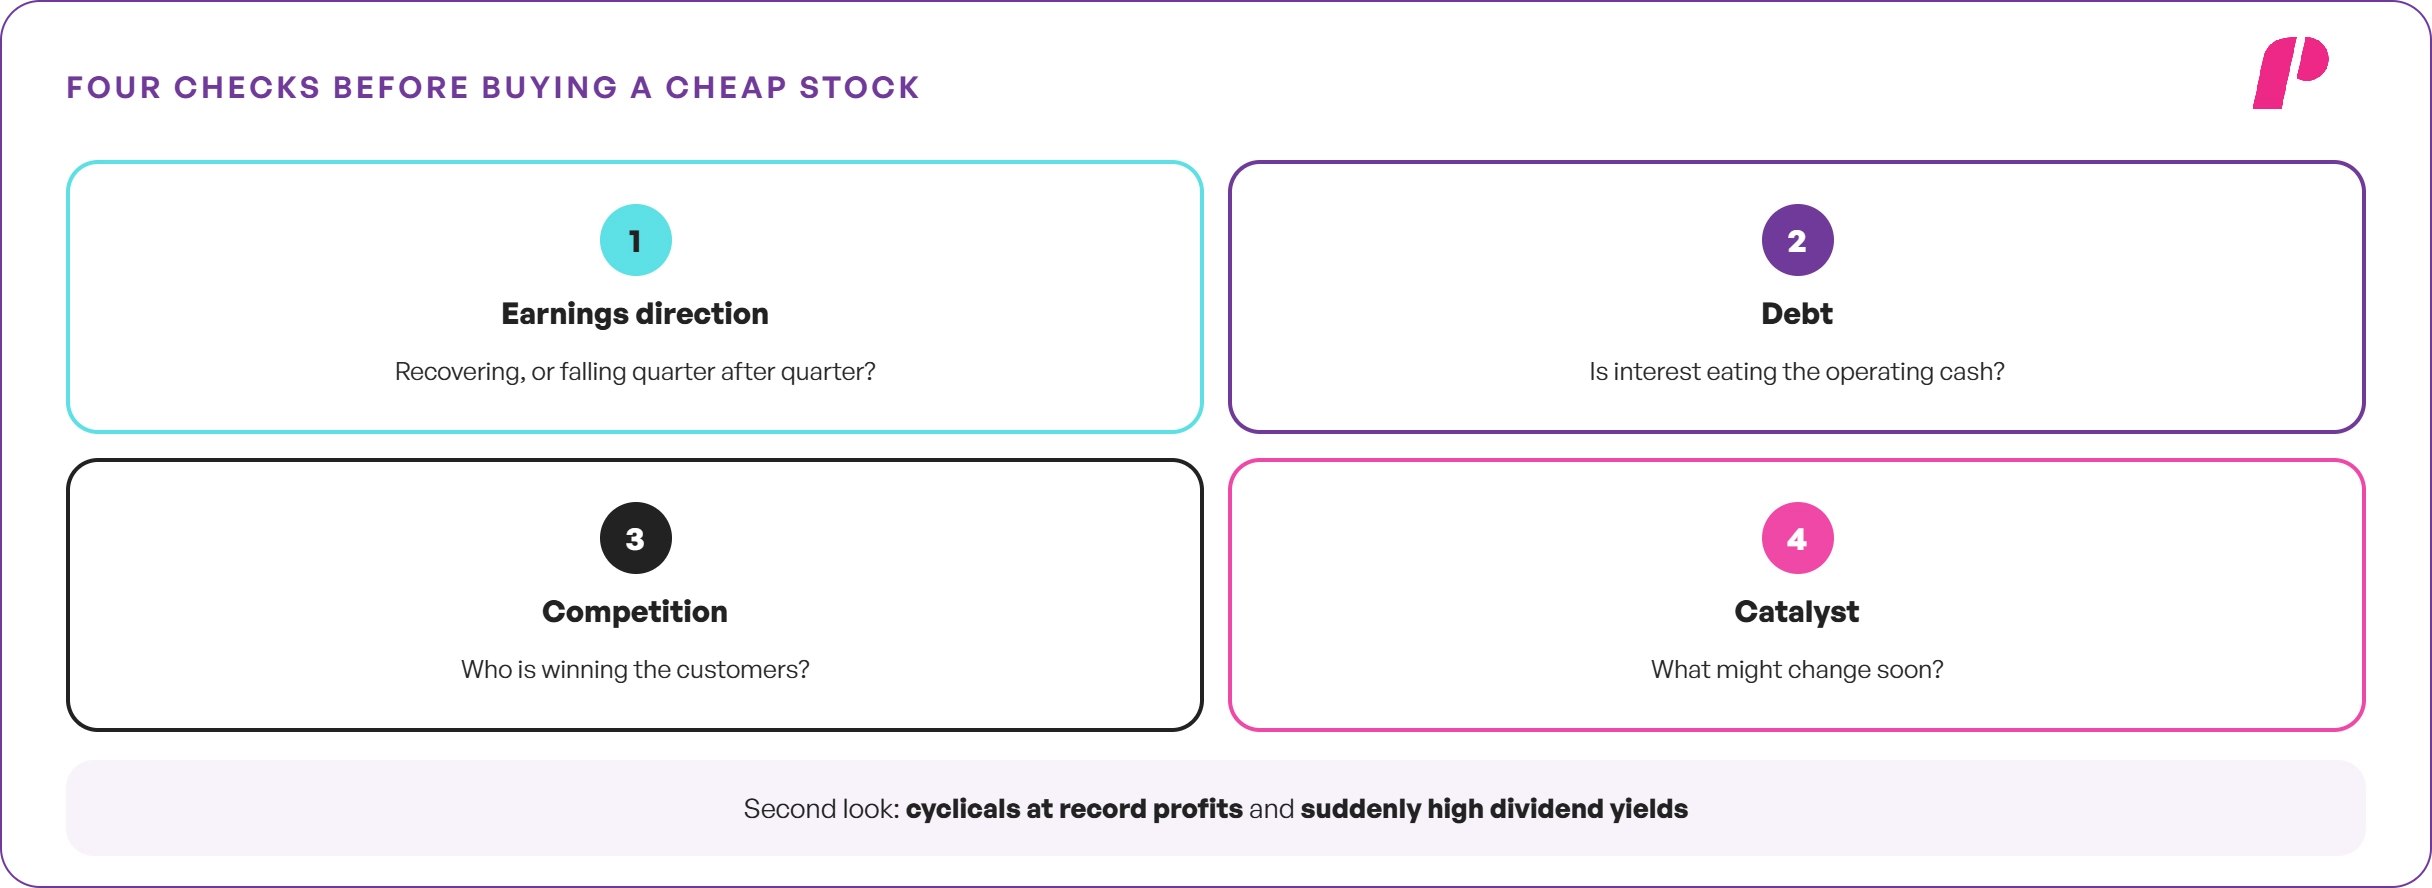
It is very difficult for anyone to determine the value-trap nature of an investment using just one ratio. It depends on four main things, which are as follows:
- Direction of earnings.
- Debt situation.
- Competitive position.
- Catalyst.
Boston Trust Walden’s May 13, 2026 note goes further, screening every stock on five quality markers.
🔗 Undervalued Stocks: Ratios, Value & Traps Explained
Deep Value Vs Value Trap
Deep value buyers go after the cheapest names and bet on recovery, which needs fixable problems. In his June 25, 2026 Forbes column, Osman pointed to spinoffs, asset sales, new CEOs, and activists as triggers. As a result, a cheap stock with no visible catalyst can stay cheap for years.
🔗 What Is a Stock Catalyst? How to Find and Trade One Safely
A company in real decline usually reports the damage several quarters before its stock finds any floor.
Warning Signs Of A Value Trap
Falling Revenue, Margins, And Cash Flow
There are certain signs that value traps have in common, and one of these is revenue. This is normally where things start unraveling, with a fall in sales, reduced margins, and the cash used for stock buybacks ending up with the creditors. The fact that two consecutive years have declining sales indicates something more fundamental.
Equity Due Diligence & Risk Framework
| Warning Sign & Red Flag | Due Diligence Verification Check | Where to Find / SEC Filing Source |
|---|---|---|
| Falling Revenue and Operating Margins | Analyze multi-year historical performance (e.g., eight-quarter trend) | Quarterly (10-Q) and annual (10-K) filings via SEC EDGAR |
| Rising Debt Burdens & Leverage | Compare total debt obligations against operating cash flow generation | Annual report (10-K) balance sheet statements |
| Shrinking Industry & End Markets | Evaluate customer loss rates and broader market demand trends | Annual report (10-K) “Risk Factors” disclosure section |
| Uncovered or Unsustainable Dividend | Benchmark total dividend payouts against free cash flow (FCF) | Quarterly and annual statement of cash flows |
| Chronic Management Turnover | Track frequent departures and changes in senior executive leadership | Regulatory filings (8-K) and official corporate press releases |
Rising Debt And Management Turnover
Meanwhile, rising debt forces a company to spend cash on interest instead of fixing the business. Frequent senior management turnover can also signal that the board lacks a working recovery plan. Wall Street Prep, in a guide updated July 17, 2024, weighs management’s past initiatives and their outcomes.
The Dividend Value Trap
Income investors often ask a related question: “Is a high dividend yield a good sign?” Not always: a yield can rise simply because the share price has fallen, which may signal trouble. For example, dividend trap stocks follow this math: $2 a year yields 4% at $50, then 8% at $25.
🔗 What Is a Dividend Trap? How to Check If a Yield Is Safe
The same symptoms keep turning up in different industries, usually for a small number of repeat reasons.
Common Value Trap Types, With Examples
Technology Disruption
Examples of value traps are normally associated with disruption, declining companies or cyclicals at their highest point. Disruption is the one we know best, where a more efficient or superior product causes customers to defect from the incumbents. The old brand can stay famous for years while customers quietly move their spending elsewhere.
The Melting Ice Cube Business
A melting ice cube business still earns money today, but its market shrinks a little more every year. Meanwhile, its single-digit P/E can look attractive even as the customer base shrinks each quarter. As a result, steady cash flow today offers little protection when next year’s business is smaller.
🔗 P/E Ratio Explained: What It Is and What Is Good (2026)
Cyclical Stocks at Peak Earnings
Cyclicals play the nastiest trick, because record profits shrink the P/E right before they fall away. A hypothetical $50 stock earning $10 a share at its peak trades at a P/E of 5. When earnings slide back to $2, the price can sit still at $50 and the multiple jumps to 25.
Cyclical Valuation Trap Analysis
| Cyclical Scenario & Market Context | Share Price ($) | Earnings per Share (EPS) | Price-to-Earnings (P/E) Ratio |
|---|---|---|---|
| Peak of the Business / Earnings Cycle | $50.00 | $10.00 per share | 5.0x ($50.00 ÷ $10.00) |
| Earnings Collapse & Cyclical Mean Reversion | $50.00 (Unchanged) | $2.00 per share | 25.0x ($50.00 ÷ $2.00) |
🔗 Cyclical Stocks: Why a Low P/E Can Mislead
Expensive stocks can fail in a similar way, and GMO measured how badly that failure hurts.
Value Trap Vs Growth Trap
What A Growth Trap Is
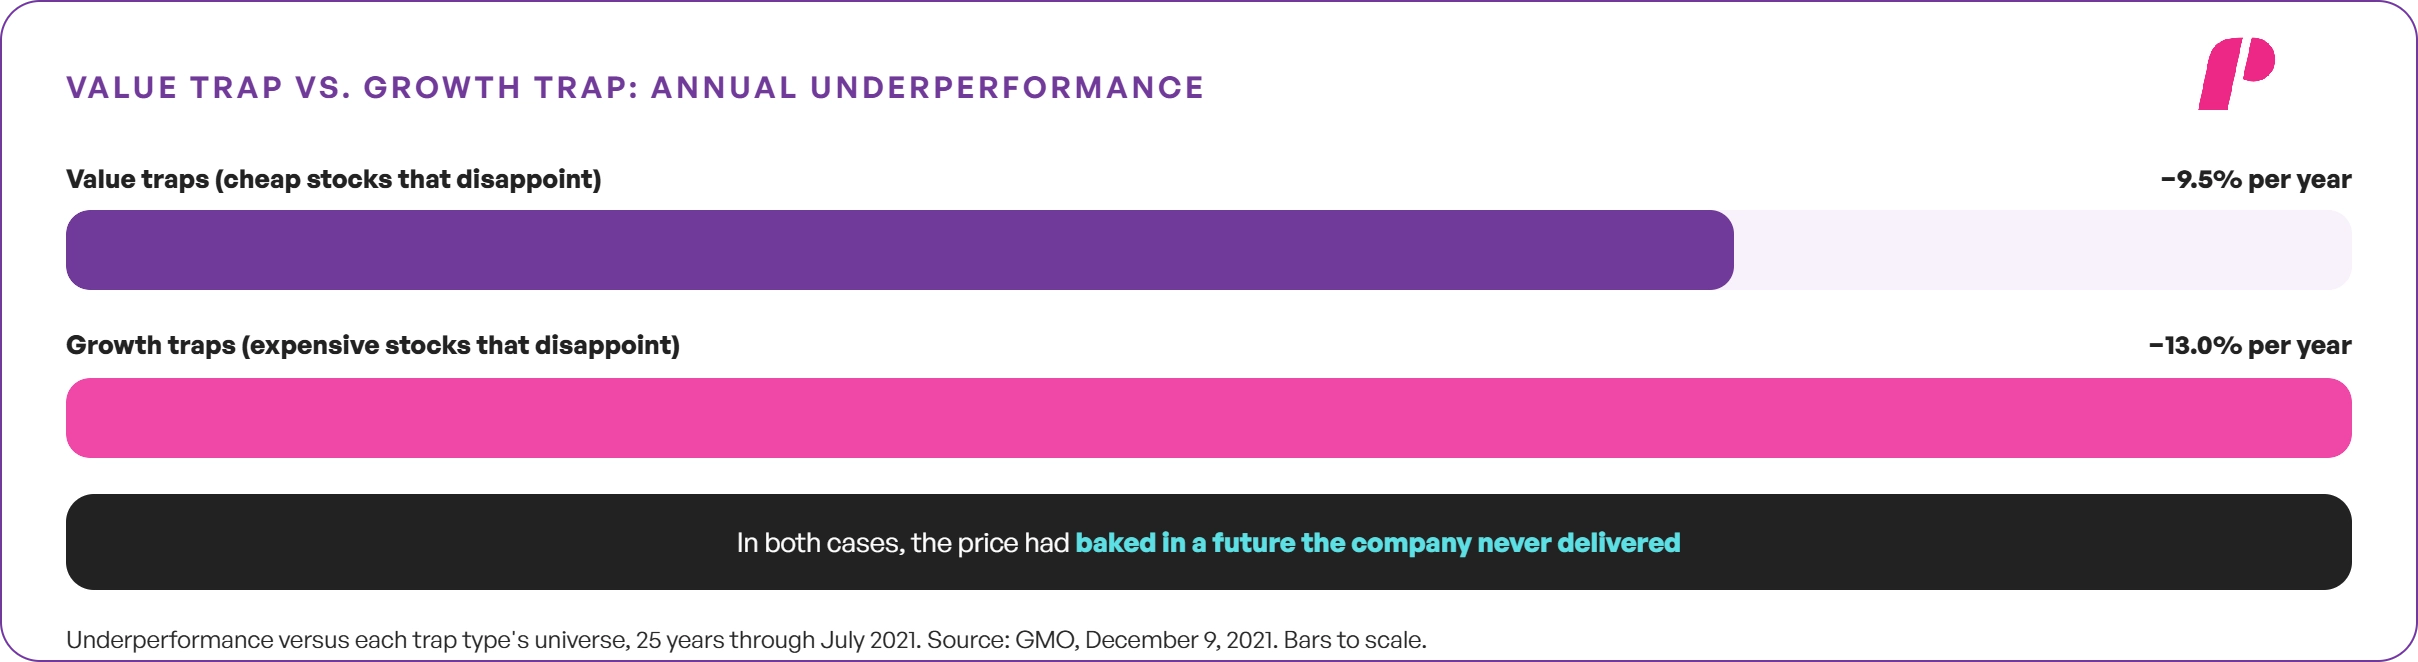
A growth trap runs the other way from a value trap: the stock is expensive, and the business disappoints. In both cases, the price had baked in a future that the company never delivered. Asking what the price assumes works on any stock, whether it trades at 6 times earnings or 60.
What GMO’s Research Found
Asset manager GMO tracked both trap types for 25 years in research published December 9, 2021. Through July 2021, value traps trailed their universe by 9.5% per year, and growth traps trailed by 13.0%. In contrast to popular belief, expensive stocks that disappointed hurt investors more in that study.
🔗 Growth Stocks vs Value Stocks: Key Differences Explained
Can a Value Trap Recover?
A hopeful question follows: “Can a cheap, declining stock still turn into a good investment?” Sometimes, but nobody can count on it: recovery needs the business problem fixed, not just more time.
Furthermore, GMO defined a trap as a sales miss plus falling sales estimates, so revisions deserve attention. For a trader, all of this matters most at the moment of entry, before any position exists.
How Traders Avoid A Value Trap With A Funded Account
Wait For Confirmation Before Entry
Traders avoid a value trap by demanding a reason to buy beyond a low multiple. Most people look up how to avoid value traps after a position is deep in the red. A better habit is waiting for signs that the selling has run its course before buying.
- Earnings estimates stop falling
- A convincing catalyst, like a new CEO or a spin-off
- Insider trading by the company’s management
- Price stops making new lows
🔗 Position Sizing in Forex & Stocks: Calculate Trade Size & Risk
Why Averaging Down Breaks Loss Limits
Traders then ask a tempting question: “Should a trader average down on a falling stock?” Only with a written plan: averaging down lowers the average price but also increases the position at risk. For example, in a hypothetical trade, 100 shares at $50 plus 100 at $40 lose $3,000 at $30.
Averaging Down Risk Modeling
| Purchase Step | Shares | Buy Price | Total Cost | Portfolio Value at $30.00 | Unrealized Loss |
|---|---|---|---|---|---|
| First Buy Allocation | 100 shares | $50.00 | $5,000.00 | $3,000.00 | -$2,000.00 |
| Second Buy (Averaging Down) | 100 shares | $40.00 | $4,000.00 | $3,000.00 | -$1,000.00 |
| Total Combined Position | 200 shares | $45.00 average cost | $9,000.00 | $6,000.00 | -$3,000.00 total loss |
🔗 Averaging Down: When It Helps and When It Hurts
A Pre-Trade Checklist For Cheap Stocks
Without the second purchase, the same move costs $2,000, so the extra buy added $1,000. Trade The Pool’s October 2026 Program Terms suggest risking at most 30% of the Daily Loss Limit per trade. As a result, a second buy that doubles exposure can push the day into a Daily Pause.
Equity Due Diligence & Risk Management Framework
| Step # | Due Diligence & Risk Management Check | Why It Matters / Strategic Importance |
|---|---|---|
| Step 1 | Determine why the stock is currently trading cheap | Separates a temporary operational setback from a permanent structural decline |
| Step 2 | Identify a clear catalyst or stabilizing earnings baseline | Provides fundamental justification for a long position beyond just a low valuation |
| Step 3 | Verify if the stock has stopped printing new lows | Avoids catching a falling knife and entering an active, unmitigated downtrend |
| Step 4 | Calculate and write down stop-loss and position sizing | Strictly caps potential trade losses before executing any market entry |
| Step 5 | Account Daily Loss Limit (per Program Terms) | Ensures compliance; breaching this threshold triggers an automatic Daily Pause |
🔗 Prop Firm Risk Rules: How to Trade Without Breaching Them
None of these steps is complicated, but each one has to happen before the order goes in.
Key Takeaways On Avoiding A Value Trap
A value trap usually looks fine on a screen, and the damage shows up in the quarterly reports. A low P/E or a fat dividend yield starts the research, before any money changes hands.
Often the market priced the stock that low because it had already read those same reports. The checks stay short: earnings direction, debt, who is winning customers, and what might change soon.
Cyclicals at record profits and suddenly high yields deserve a second look, since both can hide decline. GMO’s December 2021 research also showed that expensive stocks that disappoint can hurt even more.
A list of low-cost stocks that bounced back and those that continued losing value is very instructive despite its simplicity. Once you have filled in about 12 entries in your list, it becomes easy to distinguish between poor performance and failure.
As a result, fewer bargains turn into traps, and more capital stays available for stronger setups. Traders who want to apply these risk rules on a funded stock account can review the Trade The Pool program.
Its Program Terms set out the Daily Loss Limit and other limits that every plan for falling stocks should respect.
If you liked this post make sure to share it!