Trade Ideas – the New Toolset for TTP Traders

Introduction

We are so very happy to introduce another new partner – Trade Ideas, the must-have stock-Scanner for All Active Traders.
This tool is available for free when you sign up for TTP!

And remember that, because here at Trade Pool, we always strive to offer our traders the best, Trade Ideas is now free for you to use when you sign up for a trading account with us!  What are you waiting for? Join us now while the offer lasts!

Interview with Chris Varley from Trade Ideas

What is Trade Ideas

Trade-Ideas is a software platform that provides traders with a variety of tools and features to help them make more profitable trades. The platform offers a wide range of alerts, filters, and scans that can be customized to suit the needs of individual traders. One of the key features of Trade-Ideas is its real-time data, which allows traders to quickly and easily identify and act on opportunities as they arise. Additionally, the platform includes a feature called Stock Racing which allows traders to see a narrow-pointed view of the stocks that meet their filter criteria and are moving in the direction they want to see at that time.

real time racing scanner from trade ideas

Identifiers, Indicators and Filters

The platform also provides a wide range of other tools and features that can help traders to improve their performance, including tools for identifying patterns, indicators and other technical analysis tools, and a variety of filters that can be used to narrow down the list of stocks that are being considered for trading. Additionally, Trade-Ideas provides traders with a number of educational resources and resources that can help them to improve their trading skills and strategies.

customized filters on trade ideas

Trade Ideas is Easy to Use and fully Customizable

One of the major benefits of using Trade-Ideas is the ease of use and the ability to customize the platform to suit the needs of individual traders. The platform is designed to be intuitive and user-friendly, and it does not require any coding experience to set up and use. Additionally, the platform is highly customizable and can be tailored to suit the needs of traders of all experience levels, whether they are novice traders or experienced professionals.

This tool is available to TTP’s funded traders, FOR FREE!

Trade-Ideas Overview

This is how Chris from Trade-Ideas and Michael Katz from Trade The Pool use the scanning platform to find the right stock to trade on-

How to get Trade Ideas Free?

Unlock the full potential of your trading strategy with Trade The Pool’s latest offer!

By signing up for an account with TTP, you’ll be granted full access to Trade Idea, allowing you to explore all the advanced features on the platform without any added cost.
With the Trade Ideas scanner free, you’ll have the power of cutting-edge tools at your fingertips, helping you trade better and smarter.

Don’t miss out on this incredible opportunity to add  Trade Ideas to all the other amazing tools you’ll receive access to upon signing up with Trade The Pool.

To Sum-up

Overall, Trade-Ideas is a powerful tool that can help traders to improve their performance and become more successful in their trading. Whether you are a day trader, a swing trader, or a long-term investor, Trade-Ideas has the tools and features you need to take your trading to the next level. With its real-time data, wide range of alerts, filters, and scans, and other advanced tools and features, this is an essential tool for any trader looking to improve their performance and increase their profits.

This tool is available to TTP’s funded traders, FOR FREE!

5 Ways to Avoid the PDT Rule

Introduction

There is no doubt, day trading can be a very exciting way of making a living. The focus, the fast-paced decision-making, the constant duel between buyers and sellers, and, of course, the potential profits are what make so many traders want to be day traders. However, as for all good things in life, there is a “but”; and for day traders, this “but” is represented by the PDT Rule.

In today’s article, we’ll learn what the PDT rule is and how you can avoid the PDT rule without sacrificing your trading ambitions.

What is the PDT Rule?

The Pattern Day Trader Rule (or PDT rule) is designed to protect inexperienced traders from excessive risk, but it has quickly become a thorn in the side of anyone looking to day trade. 

Established by the FINRA (Financial Industry Regulatory Authority), the PDT rule dictates any trader who executes four or more day trades within five business days is to be considered a pattern day trader and that all pattern day traders are required to maintain a minimum balance of $25,000 in your trading account at all times.

If the trader’s account doesn’t meet this minimum balance requirement, he or she will be limited to only liquidating trades, and that could cripple anyone’s trading strategy.

So, are there any ways traders with an account under $25k avoid the PDT rule, and if so, what are they?

Well, the article’s title gave that away.

Yes. There are ways. There are five ways, to be precise. Here they are:

Key Notes
The 5 simplest ways to avoid the PDT rule suggested in this article include:

  1.  Ensure to always keep your trading account above $25k.
  2. Day trade stocks from a cash account.
  3. Switch to swing trading.
  4. Trade Forex or Futures.
  5. No, no spoilers for this one.

Option 1: Increase Your Capital to at least $25,000

While it may not be the most realistic and practical solution for all traders, one way to bypass the PDT rule, of course,  is to simply fund your trading account to meet the $25,000 requirement.

This is a straightforward step, but it requires a greater capital that not every trader would be able to invest or willing to risk. If, however, you have the financial means, know that this option allows you to day trade without any restrictions.

Option 2: Open a Cash Account

Another way to avoid the PDT rule is by opening a cash account instead of a margin account.

With a cash account, there is no limit to the number of day trades as long as you have enough settled cash to pay for your purchases.

This means that while you won’t be able to day trade the same cash across multiple trades during the same day, you can still buy and sell positions as long as you wait for the previous trades to settle (which takes two business days).

Remember that trading from a cash account will allow you to avoid the PDT rule but will also greatly affect your ability to use leverage.

Option 3: Switch from day trading to swing trading

We understand that day trading and swing trading can be very different activities, and we also understand that passing from one to the other often involves having to create an entirely new strategy and trading rulebook but, to give a full view of all possible options, we had to include this one too.

As a swing trader, you would execute fewer trades and less frequently which would protect you from falling victim to the PDT rule.

Changing the type and style of trading can be challenging at first but, once used to it, you’ll realize that swing trading can be as rewarding and exciting as day trading.

Option 4: Trade Forex or Futures

If you want to avoid the PDT rule but also want to remain a day trader, you could consider trading the Forex (foreign exchange) market, or futures markets.

The Forex and the Futures markets are not as strictly regulated as the Stock market and the PDT rule does not apply.

The Forex market is open 24/5, allowing for lots of opportunities to day trade and futures trading can offer substantial leverage and, most importantly, trading either means you won’t have to worry about the PDT rule at all.

However, do keep in mind that switching from stocks to currencies and futures will also require new research, learning, and trading strategies.

Option 5: Utilize a Proprietary Trading Firm

If you love day trading and stock is all you care about, this is the perfect way for you to remain a stock day trader and avoid the PDT rule at the same time: Join Trade The Pool, the stock prop trading firm!

Trade The Pool allows you to day trade stocks using their capital rather than your own, which means you won’t have to part with $25k of your hard-earned money or switch to swing and futures trading unless you really want to.

If you are wondering how this is possible, remember that the PDT rule was introduced to protect small traders’ capital, but since you’d be trading TTP’s capital rather than yours, the PDT rule doesn’t apply.

stock prop firm to avoid the pdt rule

Furthermore, while free from all PDT impositions, by signing up with Trade The Pool, you also gain access to various trading and research tools as well as a supportive environment.

If you are worried about not being capable or experienced enough yet, stop worrying; by taking a look at the website, you’ll find that TTP provides lots of educational content including this blog, ebooks, interviews, live trading videos, and much more. It doesn’t cost anything and can be greatly beneficial for traders looking to sharpen their skills.

Conclusion

All of these four options will allow you to avoid the infamous PDT rule and, although it could mean having to change the way you trade, who knows, you might end up being more successful in your new discipline than you were at day trading.

However, if you read this article because you feel you are at risk of breaking the PDT rule, you are probably a stock day trader. And if you are a stock day trader it is because that’s what you love doing and have trained to do.

Well, at Trade The Pool, the team believes that talented traders should be allowed the freedom to do what they’re good at; and if that happens to be day trading stocks, then so be it. They’re behind you all the way.

This is why, if you love stock day trading and want to avoid the PDT rule while remaining true to yourself, option 5 is the one that makes sense.

I hope this helps.

The Best Stocks for Swing Trading

Introduction

As you probably figured out by now, swing trading comprises technical analysis, market awareness, and – last but not least – an abundant dose of good old intuition.

Finding the best stock to swing trade at the right time is not just the first step; it could literally make the difference between making a profitable trade and receiving a margin call.

So, how do successful traders find the right stocks for swing trading amongst thousands? Isn’t that the infamous needle in the haystack?

Well, answering that first question is exactly what this article is all about.

Ready? Let’s get right in!

First things first: the MARKET

Before jumping into the more specific points, it is important to consider the overall market conditions at the time of trading. The best stocks for swing trading can vary significantly depending on whether the market is bullish, bearish, or in a sideways trend. Your ability to adapt your swing trading strategy to the current market environment and to choose stocks accordingly could be the key to your success.

Key Notes
When choosing the best stock to swing trade during a:

  • Bull Market

    Focus on stocks showing strong upward trends and/or bullish chart patterns like an ascending triangle or a cup and handle formations.

  • Bear Market

    Look for opportunities to short stocks showing strong downward momentum and/or forming bearish patterns such as a head and shoulders or a descending triangle.

  • Sideways Market

    Range-bound stocks ranging between clear support and resistance levels can be a great choice for traders who are fans of channel trading techniques.

VOLATILITY is king

The love/hate relationship that every trader has with volatility oscillates from one side to the other according to our last trade success -or lack of it. But, let’s be honest with ourselves, if it wasn’t for volatility, none of us could be making any money from trading the markets.

Look for stocks that are known for being volatile and frequently experience significant percentage changes. Tech and biotechnology companies, for example, can be prime candidates due to their inherent sensitivity to news and hype.

Use a good stock screener to identify stocks with a high ATR (average true range).

best stocks for swing trading - identify ATR
Google (GOOGL)’s ATR overlapping its price action

As we found out in a past article, the ATR reflects the average movement of a stock during a specific timeframe, and higher values hint at more significant price swings. You can also set filters for percentage gainers or losers to spot stocks that made substantial moves in recent days.

Turn the VOLUME up!

High volume generally means high liquidity and liquidity is paramount in swing trading.

Higher trading volumes often also lead to tighter spreads and more predictable price movements. Stocks with high volume also tend to call for more institutional interest and that, in turn, increases the likelihood of the current trend continuing.

You can highlight stocks that are experiencing high volumes by monitoring the VWAP (Volume-Weighted Average Price) and volume spikes alongside price movements.

For best results, look for stocks that show increased volume at the same time as a price breakout. Stocks in situations like that could often be great swing opportunities.

Google (GOOGL)’s VWAP

The fundamentals are FUNDAMENTAL

News and Catalysts

Market-moving news and catalysts can be a swing trader’s best friend or worst enemy.

Keep up with financial news (and with those that concern your stock of choice in particular) and be aware of potential upcoming catalysts.

Rapid changes in stock prices often come down to news releases, earnings reports, or public announcements.

Consider, as an example, any of the companies in the technology sector. The announcement of a new product’s launch could give start to a bullish momentum, while regulatory setbacks, on the other hand, might cause prices to spiral downward. Tech and pharmaceutical stocks often experience significant price moves based on just these types of news.

Setting up news alerts for your watchlist or subscribing to financial news platforms can give you a timely edge. Alternatively, consult an online economic calendar regularly and carefully. Although not the best, free-access websites such as “MarketWatch” can still be very useful to day traders and swing traders alike.

Marketwatch calendar for swing trading

MarketWatch economic calendar

Sector Rotations and Trends

The last few years have seen the Tech sector dominating all others. Currently, the “Magnificent 7” – Apple (AAPL), Microsoft (MSFT), Alphabet (GOOGL), Amazon (AMZN), Nvidia (NVDA), Tesla (TSLA), and Meta (META) combined represent around 30% of S&P500 weighting. But this wasn’t always the case in the past and it won’t always be the case in the future either. From time to time, investors’ interest (and money) moves from one sector to another. That’s what the market calls “sector rotation”.
The ability to predict future sector rotations could give swing traders the opportunity to short stock from one sector while simultaneously going long on stocks of a different industry.

Key Notes

  • One of the simplest, fastest, and most popular methods of identifying the best stock to swing trade amongst the thousands on the market is to use a good stock screener.
  • Amongst other criteria, a stock screener allows traders to highlight and identify stocks with high volatility, high volume, and/or powerful trends.
  • Good stock screeners come at a price, it’s true, but by signing up with Trade The Pool, you can get access to FinViz -one of the best stock screeners around.
  • TTP has also created 3 screeners of their own on FinViz that you can use immediately and for free.

PRACTICE, learn, improve, and refine

Swing traders need to be dynamic. There is no way around that.

Remember, what worked yesterday might not work again tomorrow.

Constantly analyze your trades, learn from your losses, and adapt to evolving market conditions.

Keeping a trading journal can help track your decisions, refine your strategies, and better understand the dynamicity of the stock market. (Trade the Pool has thought of this too. Check out our fantastic offer on Tradervue, best trader’s journal you could put your hands on).

ttp - a prop firm for stock traders

Conclusion

In essence, finding the best stock to swing trade involves a blend of volatility analysis, trend-following techniques, and careful market observation.

By staying dynamic, practicing and improving your technical analysis skills, and remaining up to date with news catalysts and sector shifts, you can significantly increase your odds of success at swing trading.

It is important to keep experimenting, analyzing, and refining your strategy, as the market will always be full of fresh opportunities waiting to be explored by savvy traders like you.

I hope this helps.

3 of the Best Indicators for Swing Trading

Introduction

In past articles on swing trading, we’ve already spoken about Fibonacci, Moving Averages Crossovers, Channels, and Bollinger Band and how they are used to either assess or try to predict the market. However, these are just a few of the many indicators swing traders employ to increase their accuracy and consistency.

In today’s article, we’ll discover three more great indicators that, although popular amongst day traders, seem to assume a much higher level of accuracy when applied to longer timeframes.

Well, without further ado, I give you the ATR, the EOM, and the OBV. You might want to get acquainted.

3 of the Very Best Indicators for Swing Trading

Key Notes

  • The technical indicators for swing trading we’ll discuss in this article are all available online for free and come as standard on most trading platforms.
  • These three indicators are meant to be used as part of a complete strategy and not as a complete strategy.
  • Expanding your knowledge and experience with indicators like these could provide that little extra that could allow you to pass your challenges and become a TTP’ funded trader.

The ATR

The ATR (Average True Range) indicator stands as a cornerstone for traders aiming to gauge market volatility. Developed by J. Welles Wilder Jr., the ATR doesn’t forecast market direction but measures the range of price movements, providing invaluable insights into market behavior.

On a typical trading chart, the ATR is displayed as a single line beneath the main price chart. This line moves up and down, reflecting the fluctuating volatility levels over a specified number of periods which, on most trading platforms, is 14 by default. This means that if left on the default settings, the ATR will indicate the average range of the last 14 bars or candles. However, traders can tweak the settings to suit their strategies (shorter periods like 7 or 10 make the ATR more reactive to recent price changes, while longer periods like 20 or 25 offer a smoother and less sensitive measure of volatility).

ATR - best indicators for swing trading

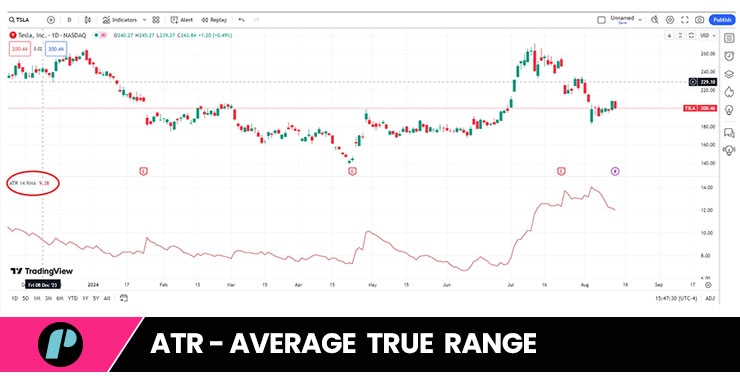
Image 1, for example, shows a daily Tesla (TSLA/Nasdaq) chart with the stock trading at $200.46 and the ATR indicating 12.01. This suggests that, on average, Tesla’s price has moved within a daily range of $12.01 over the 14 days.

Swing traders often use this information to calculate their stop-loss levels, for example, placing a stop-loss too close might result in premature exits due to typical market noise. In other words, if a swing trader was to open a long position on TSLA now, at £200.46, for example, he or she would better consider that price is likely to move up to $12.01 in either direction just on the basis of the usual expectable noise.

To also accommodate for a little extra volatility, swing traders are known to set their stop-losses at a greater distance from break-even than even the ATR suggests. For example, stops at 1.5xATR and 2xATR are very common. The ATR is also often used in a similar way to set the take-profit for an entire position or a part of it.

There is more. The ATR also helps with determining position sizes. A higher ATR indicates greater volatility, which might suggest considering smaller position sizes to manage risk, whereas a lower ATR suggests less volatility, allowing for potentially larger positions.

And… although it’s not a predictive indicator, in its own way, the ATR can still advise traders that it’s a great time to buy for future gains or warn them that it’s high time to sell.

For example, if a swing trader notices the ATR of a stock increasing significantly, it could be a signal to lock in profits or tighten stop-loss levels, anticipating potential price swings. Conversely, an ATR decline might indicate a consolidation phase – an opportune moment to prepare for a breakout.

The EOM

The EOM (Ease of Movement) indicator is a unique tool designed to measure the relationship between price changes and volume.

Simply put, the EOM helps traders identify how easily a security’s price moves and that knowledge can be a valuable asset for traders looking to gauge the potential strength or weakness of a price move.

The EOM indicator is typically plotted as a line that oscillates above and below a zero line. When the EOM is above zero, it indicates that the market is moving upward with ease, and when it is below zero, it suggests the market is moving downward effortlessly. And, as for the ATR, the longer or shorter the period set for the EOM, the more smoothed or reactive the line will be.

eom indicator for swing traders

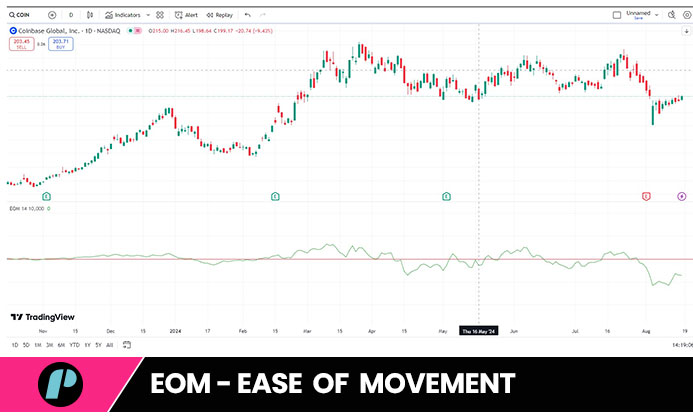
Here’s another example:, Image 2 shows Coinbase (COIN/Nasdaq) currently trading at $ 203.45 and its EOM below the zero line. This could imply that the stock is experiencing bearish price movement with relatively low volume, suggesting that the bears are in control without facing significant resistance. Conversely, when the EOM is above zero, it could indicate that the price is moving up, and the bulls have the upper hand.

By default, the indicator is set at a period of 14, similar to the ATR. However, depending on the trading strategy and timeframe, this setting can be adjusted.

The EOM is particularly useful for confirming the strength of a trend or predicting potential reversals. For example, a swing trader might look to enter a long position when the EOM moves from below to above zero, indicating that upward price movements are gaining momentum with relative ease.

In Coinbase’s case, swing traders whose strategy recommends opening a bullish position may instead consider waiting to see the EOM shifting above zero (a sign of a potential imminent strong upward move) before doing so.

When the EOM indicator hovers around the zero line, it suggests that the price movements are balanced with the volume, indicating little directional bias. This period could be an excellent time for swing traders to prepare for the next significant move.

Key Notes
Trade the Pool has recently launched a program tailored specifically to swing traders.
It also includes:

  • Almost any stock and ETF in the U.S. markets.
  • Overnight and over-the-weekend position holding allowed.
  • Reach 3 times your max DD. If your max DD = $2,100, reach $6,300 in profit and get a TTP-funded account

The OBV

The OBV (On Balance Volume) indicator is all about the relationship between volume and price movements.

The OBV uses cumulative volume changes to predict potential price direction and what makes it stand out is that, unlike many other indicators – which tend to focus solely on price action – the OBV provides useful insights into the volume’s role in price trends.

The OBV is displayed as a single line on a trading chart. This line is calculated by adding the volume on up days and subtracting the volume on down days, resulting in a cumulative volume total.

When the OBV line is rising, it indicates that volume is higher on up days and lower on down days, suggesting that buying pressure is dominant. Conversely, a falling OBV indicates that selling pressure is increasing as the volume is higher on down days and lower on up days.

In this last example, we’ll look at Nike’s (NKE/NYSE) daily chart.

best indicators for swing trading - obv

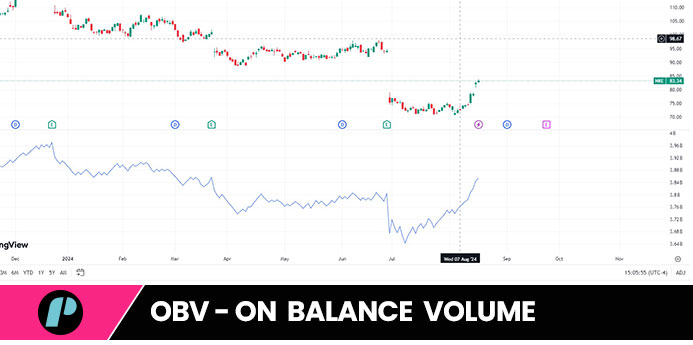
Image 3 shows Nike currently trading at $ 83.34 and the OBV that seems to have been trending upward for at least the last five weeks or so.

This implies that the cumulative volume on days when the stock closes higher is greater than the volume on days when the stock closes lower and this could suggest a strong buying interest and potentially bullish Nike’s price action.

As for the ATR and the EOM, swing traders use different OBV settings based on their strategies. Some might prefer a default period of 14, allowing them to align with the stock’s typical price patterns, while others might customize this period as needed.

In a swing trading strategy, the OBV can be extremely useful for confirming trends and predicting breakouts.

In Nike’s example, looking at the chart, we notice the OBV rising while the stock price also started to trend upwards. This could indicate strong buying support and may confirm the current bullish trend.

In this case, a trader might decide to hold onto their long position, anticipating further gains.

On the other hand, If nike’s OBV should start to decline while the stock price remains stable or also begins to drop, it could signal weakening buying and a potential for a bearish reversal.

There is more.

ttp - a prop firm for stock traders

The OBV can be helpful when used in conjunction with other technical indicators. For instance, combining the OBV with moving averages or support and resistance levels can refine a trader’s analysis and increase the likelihood of successful trades.

(And by the way, remember that the ATR, the EOM, and the OBV are not stand-alone trading strategies. They were built to be used in conjunction with other indicators or price patterns).

Let’s take, for example, the OBV used in conjunction with a moving average crossover.

If the 50-day moving average crosses above the 200-day moving average, it’s a bullish signal and If this crossover coincides with a rising OBV, then it sure strengthens the case for entering a long position.

Conversely, if the moving averages signal a bearish crossover and the OBV is falling, it could be a strong indication to enter a short position.

Best indicators for swing trading – Conclusion

And there you have it! Three indicators that have made fortunes for many swing traders in the past and that will keep doing so in the future.

As always, use caution, get confirmation, and risk-manage.

This was a long one but I hope this helps, traders.

Merry Xmass. Happy New 2024 Year