You can pick winning stocks and still lose money in the market. The problem is rarely the stock itself. One oversized loss can erase months of steady gains in a single afternoon.
Risk management, not stock-picking, is usually what decides who survives long enough to compound. It’s the system that keeps every loss small and recoverable, trade after trade.
So what is risk management in the stock market, and how do you actually apply it? This guide covers the definition, the 1% rule, position sizing, stop-losses, and risk-reward, then closes with the survival math and how the same rules apply on a funded stock account. Get this right, and capital gets protected through discipline rather than luck.
What This Guide Covers
- What risk management is and why it protects your capital
- The main types of risk and the core techniques used to manage them
- The 1% rule, position sizing, and the survival math behind it
- Risk-reward, expectancy, and the diversification trap
- The most common mistakes and the psychology driving them
- How do the same rules apply to a funded stock account
What Is Risk Management in the Stock Market?
Risk management in the stock market is the process of identifying, sizing, and controlling how much any single trade can cost you. It combines position sizing, stop-losses, and diversification into one working system.
Skill at picking stocks doesn’t protect against a badly sized position. A trader can time entries well for months and still get wiped out by one trade held too large, which is why risk management is treated as the foundation everything else sits on.
Why It Matters
Here’s the blunt version: pick winners, time entries well, and one oversized loss can still wipe out months of work. Risk management doesn’t eliminate losses; it was never meant to.
It makes them small and survivable, so the goal becomes controlled loss across many trades, not zero loss. Traders who accept that tend to last longer than those chasing a perfect record.
Risk Management vs. Money Management
People throw these two terms around like they mean the same thing, but they don’t. Risk management deals with a single trade, capping your loss through position size and where you set your stop.
Money management is broader: how capital gets allocated across many trades and how fast you scale up after a win. A trader can have flawless per-trade risk control and still mismanage overall capital by overcommitting to one sector.
Risk Management Architecture: Core Portfolio Protection Tools & Strategic Applications (2026 Reference)
| Risk Management Tool | Functional Mechanism | Optimal Strategic Application |
|---|---|---|
| Position Sizing | Scales active trade exposure directly to predetermined risk limits | Mandatory for every execution to strictly cap individual capital loss |
| Stop-Loss Orders | Executes automatic liquidation at a preset maximum loss threshold | Defines total downside exposure prior to entering any market position |
| Risk-Reward Ratio | Compares projected upside profit potential against downside risk exposure | Serves as a quantitative filter to determine which setup executions are viable |
| Asset Diversification | Spreads capital allocation across uncorrelated sectors and asset classes | Significantly minimizes single-name catastrophic volatility impact |
| Portfolio Hedging | Offsets primary risk exposures using derivative contracts, options, or futures | Protects active holdings against sharp, macroeconomic downside swings |
🔗Money Management
Types of Risk & Core Techniques
Managing risk starts with naming it. A trader can face several risks at once: market risk, inflation risk, sector risk, liquidity risk, and single-stock risk. Sizing and diversification go a long way against market risk.
Inflation risk is a different story, since there’s little you can do about it at the trade level. Treating every risk the same way is one of the quieter mistakes new traders make.
The Main Types of Stock-Market Risk
Market-wide moves affect nearly every position at once, no matter how carefully it was chosen. Sector risk narrows that to a single industry selling off together. Liquidity risk shows up when you can’t exit a position at a fair price, often in thinly traded names.
Single-stock risk is company-specific: an earnings miss can sink a position regardless of what the broader market is doing. No single tool covers all of these, so the defense has to change with the risk.

Core Techniques: Sizing, Stops, Diversification, and Hedging
Most of the heavy lifting comes down to five tools: position sizing, stop-loss orders, diversification, a defined risk-reward ratio, and hedging. Stacked together, they cover each other’s blind spots.
Hedging is the least talked-about of the group, offsetting a position with options or futures, like buying a put against a stock you already own. None of it guarantees a winner. It just caps how much a loser can take from you.
Allocation Frameworks: The 70-20-10 Rule and the Five T’s
Some traders step back and manage risk across the whole portfolio instead of trading by trade. The 70-20-10 rule offers one rough split: about 70% in stocks, 20% in bonds, and 10% in alternatives, meant to balance growth with stability.
The five T’s take a different approach. Once you’ve spotted a risk, you can transfer it, tolerate it, treat it, terminate it, or simply take the opportunity anyway. Neither one is a rule carved in stone.
- Market risk, from broad price moves that hit the whole market
- Inflation risk, which erodes long-term real returns and is largely uncontrollable
- Sector or industry risk, where one industry sells off together
- Liquidity risk is when you can’t exit a position at a fair price
- Single-stock risk, driven by one company’s news or earnings
- Behavioral risk from cognitive biases that distort trading decisions
🔗Hedging
The 1% Rule, Position Sizing & Stop-Losses
This is where risk management stops being theory and becomes arithmetic. The 1% rule cuts to one idea: don’t put more than 1% of your account on the line for any single trade. On a $10,000 account, that’s $100, and where your stop sits decides the rest.
How much should you actually risk per trade? The common answer is 1 to 2%, but that’s a survivability guideline, not a setting that guarantees profit. Smaller risk buys a longer runway; it doesn’t raise your win rate.

The 1% and 2% Rules
The 2% rule raises that ceiling to $200 on a $10,000 account. It’s a real option, but less forgiving during a losing streak, and CME Group education material notes plainly that the 2% threshold is essentially arbitrary. Is the 1% rule too conservative? It might feel that way until the numbers are run.
Some professionals push to 2%, occasionally 5% on a rare high-conviction setup, but those stay exceptions, not a standard. Can you just risk more to grow the account faster? A bigger risk grows an account faster, but it shrinks it faster too. At 10% risk, ten losing trades in a row can end it entirely.
How to Size a Position
Position sizing sets how many shares to buy so that hitting your stop-loss costs only your planned dollar risk. It scales the trade to the distance between entry and stop, not to how confident you feel. The formula: dollar risk divided by the per-share stop distance.
Risk Management Architecture: Worked Position-Sizing Example & Mathematical Parameters (2026 Reference)
| Position-Sizing Element | Calculated Value | Operational Note & Context |
|---|---|---|
| Total Account Capital Balance | $10,000 capital | Illustrative portfolio sizing baseline |
| Maximum Risk Allocation Per Trade | 1.0% = $100 risk | Adheres strictly to standard risk management rules |
| Planned Trade Entry Price | $50.00 per share | Example equity security execution price |
| Stop-Loss Threshold Price | $48.00 per share | Establishes a precise $2.00 risk per share limit |
| Calculated Position Share Size | 50 shares total | Derived from $100 max risk ÷ $2.00 per share stop distance |
| Total Capital Loss if Stopped Out | Exactly $100 loss | Guarantees exact alignment with the 1% account risk limit |
Setting a Stop-Loss
A stop-loss order sells a position automatically at a preset price, capping the loss before it grows, like insurance against one catastrophic move. Does it always limit the loss to that exact level? Close, but not always.
Prices can gap straight through a stop level overnight, so it manages risk rather than promising an exact exit price. That’s a trade-off worth making. Holding a losing position with no exit plan at all tends to cost far more in the long run.
🔗Stop-Loss
The Survival Math
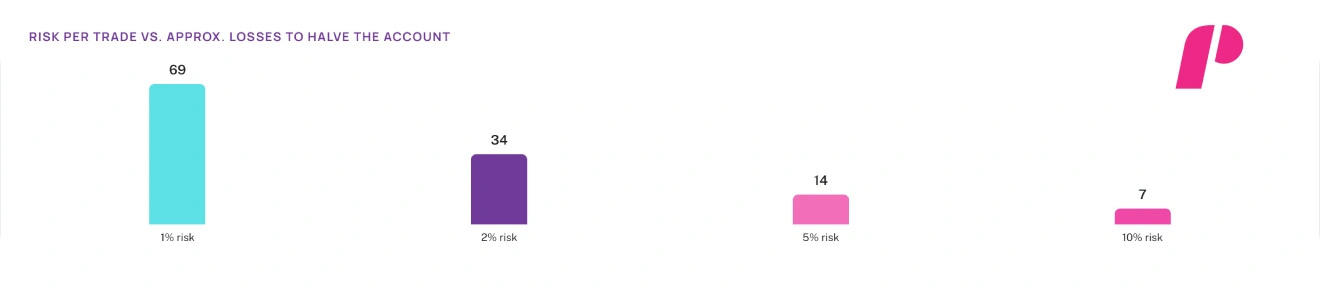
How many consecutive losses can the 1% rule actually survive? At 1% risk, it takes roughly 100 consecutive losses to wipe out an account, and about 69 to cut it in half. At 10% risk, you’re broke after just 10 straight losses.
Going all-in with no sizing plan is one of the most common ways new traders fail, and those numbers explain why. Holding risk at 1% means a 10-loss streak costs about 10% of the account, painful but survivable, and keeps both the account and your discipline intact.
Risk Management Mathematics: Trade Risk Percentage vs. Account Drawdown & Survival Thresholds (2026 Reference)
| Risk Per Trade (%) | Cumulative Loss After 10 Consecutive Losers | Approximate Losses Required to Halve Account |
|---|---|---|
| 1.0% Risk | ~10% portfolio drawdown | ~69 consecutive losses (high survival margin) |
| 2.0% Risk | ~18% portfolio drawdown | ~34 consecutive losses |
| 5.0% Risk | ~40% portfolio drawdown | ~14 consecutive losses |
| 10.0% Risk | ~65% portfolio drawdown | ~7 losses (account effectively broken after ~10 losses) |
Figures are illustrative math based on compounding losses, not a guarantee of outcome.
🔗Risk of Ruin
Risk-Reward, Expectancy & Diversification
Sizing tells you how much you can lose. Risk-reward and expectancy answer a different question: Is the trade even worth taking? The ratio itself just weighs potential gain against potential loss. At 1:3, winning a quarter of the time is enough to break even.
A good ratio, though, isn’t a fixed number. Most traders lean toward 1:2 or 1:3, but it only pays off when paired with a win rate the strategy can realistically hit.
Risk Management Mathematics: Risk-Reward Ratios vs. Break-Even Win Rates (2026 Reference)
| Risk-Reward Ratio | Break-Even Win Rate (%) | Strategic Implication & Edge |
|---|---|---|
| 1 : 1 Ratio | ~50% win rate required | Must win half of all trades just to break even on capital |
| 1 : 2 Ratio | ~34% win rate required | Can lose two-thirds of trades and still break even overall |
| 1 : 3 Ratio | ~25% win rate required | Can lose three-quarters of executions and still remain profitable |
| 1 : 5 Ratio | ~17% win rate required | A small handful of high-conviction winners can single-handedly carry the account |
Illustrative math before trading costs, not a profit promise.
🔗Risk-Reward
Why Win Rate Isn’t Enough: Expectancy
Does a high win rate mean you’re profitable? Not necessarily. It can still bleed money if the average loss dwarfs the average win. That’s the case for expectancy: the average result per trade, win rate times average win minus loss rate times average loss.
It combines win rate and risk-reward into one number that reflects whether a strategy actually makes money. Chasing a high win rate over favorable expectancy is often optimizing for the wrong thing.
🔗Expectancy
Diversification and the Correlation Trap
What is diversification, and how many stocks should you actually hold? It spreads capital across stocks, sectors, and asset classes so no single name can do too much damage. For most investors, ten to twenty positions work well, with fifteen a common sweet spot.
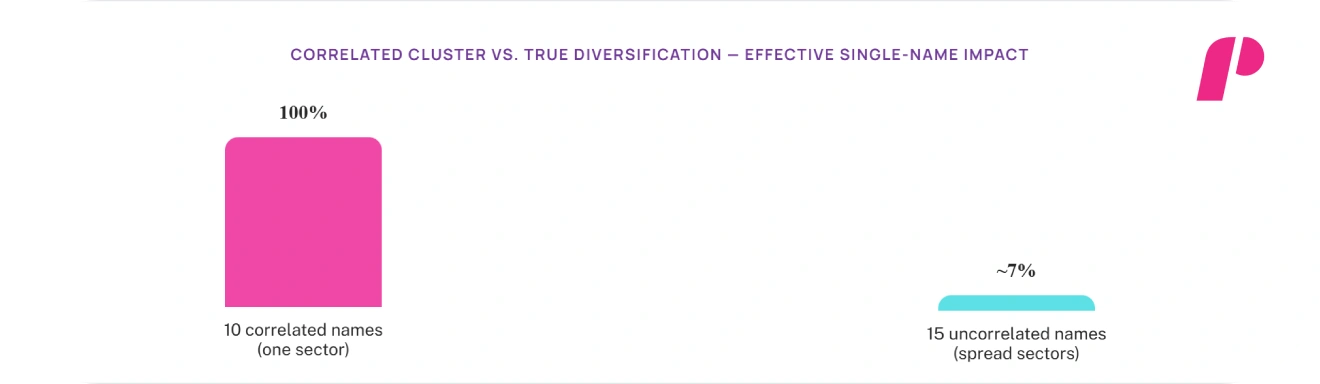
Is diversification alone enough to protect you? It helps, but a portfolio of correlated names is really one bet wearing different tickers.
Ten positions in the same sector tend to fall together, so count correlated names as a single combined risk and spread capital across genuinely uncorrelated ones instead.
🔗Diversification
Drawdown, Mistakes & Psychology
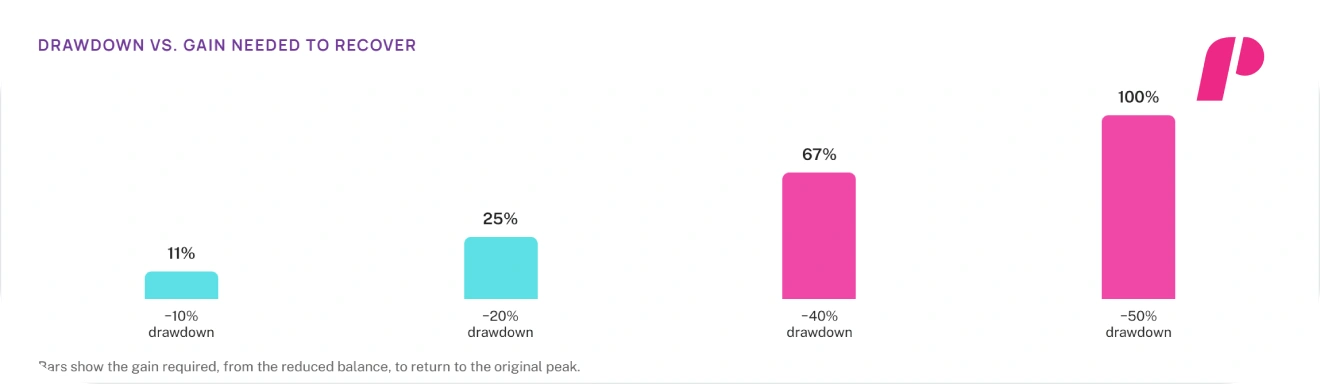
Even a solid plan runs into losing stretches sooner or later. So what is drawdown, and why does it matter? It’s the drop from an account’s peak value to its low point. Smaller per-trade risk keeps drawdowns shallower and much easier to recover from.
Drawdown and Recovery
A 10% drawdown is far easier to claw back than a 50% one, since recovery math isn’t symmetrical. A trader down 20% needs a much larger gain just to get back to even, while one down 1% recovers within days. That asymmetry is the whole argument for keeping per-trade risk small.
Common Mistakes to Avoid
What are the most common risk management mistakes? Going all-in, chasing losses, overtrading, and moving a stop-loss further away top the list, and each one converts a small planned loss into a large, unplanned one.
- Going all-in or sizing by conviction instead of by risk
- Chasing losses to try to “catch up” after a bad trade
- Overtrading, which raises both commissions and total exposure
- Moving a stop-loss further away to avoid taking a loss
- Ignoring correlation across positions that only look diversified
- Chasing a high win rate instead of favorable expectancy
Trading Psychology and Discipline
None of this is really about the numbers, not deep down. The formulas take five minutes to learn. Holding on to them once real money and real pressure show up is the actual skill.
Fear, greed, and the urge to revenge-trade quietly override a good plan more often than most traders would admit. A trader who understands the 1% rule perfectly can still blow an account by ignoring it in the moment, which is where most risk management actually breaks down.
🔗Trading Psychology
Risk Management on a Funded Stock Account
Everything covered so far applies just as directly to a funded account, with less room for error. What changes when you trade real capital through a stock prop firm? At Trade The Pool, you trade live US stocks and ETFs on buying power the firm provides, and the same rules apply under a fixed drawdown limit.
The Same Rules, a Fixed Drawdown Limit
These rules matter even more once real funding is on the line. The 1% rule and position sizing carry over directly, sized in shares against your account’s buying power rather than a cash balance. Your maximum loss is defined for you, so every position has to respect it.
The key difference is the drawdown limit. On a funded account, it is fixed and enforced, with no room to average down once breached, which makes disciplined risk the entire game. A daily loss limit sits on top of it, ending the session the moment you reach it.
🔗Drawdown Limit
Where Stock-Market Risk Meets a Funded Evaluation
The bridge here is practical, not promotional. The same survival math, sizing formula, and stop-loss discipline carry over to a funded evaluation almost unchanged. A consistency rule also caps how much any single trade can contribute, so distributed, repeatable results matter more than one big winner.
What changes are the consequence of ignoring them? Breaching the drawdown limit on a funded account ends the evaluation immediately, with no gradual slide to recover from.
Risk Management: The Skill That Keeps You in the Market
Risk management is what separates traders who last from those who don’t. It never promises that any single trade will win. What it does is keep each loss small and recoverable, so capital survives the losing streaks that are simply part of trading.
The rules are straightforward: risk around one percent, size positions to your stop, and demand a favorable reward before entering. Expectancy and diversification decide long-term survival far more than any single trade does. On a funded account, that same discipline becomes the whole game.
Build these rules into your process before your next trade, not after a loss forces the issue. Ready to apply disciplined risk on a funded stock account?
If you liked this post make sure to share it!