
Newmont (NEM): Can Peak Gold Become Lasting Value? On October 14, the Newmont stock price finished the session at $111.56, down 3.5% for the day. Compared with its 52-week low, the stock is about 47% higher.
Nevertheless, it still sits roughly 18% under its high of $135.29. Part of the reason is gold itself, which has cooled to around $4,100 an ounce, more than 25% below its January record near $5,590.
🔗Gold Stocks Explained: How They Work and How Traders Approach Them
A hotter September CPI print (3.7% year over year) lifted bets on a Fed rate hike, and bullion lost some of its pull as a result. Meanwhile, Newmont will publish its third-quarter results on October 22.
The central question is timing. Newmont has been earning record cash, but gold is no longer near its record. Yet management calls 2026 a planned production trough, with growth only returning from 2027.
🔗Consumer Price Index & Core Inflation: US Market Guide
In our view, the company has used the windfall well. The Newmont stock price now depends on whether that discipline outlasts the gold cycle.
The Numbers Behind the Newmont Stock Price
The best place to begin is 2025, a year in which several records fell. Attributable gold production for the year came to 5.9 million ounces.
Alongside the gold, Newmont mined 28 million ounces of silver and 135,000 tonnes of copper. On the cash side, operating cash flow was $10.3 billion.
Free cash flow was even more notable, since $7.3 billion is the highest figure in the company’s history.
Newmont Full Year 2025 Financial & Operating Results
| Financial Item & Operating Metric | Full Year 2025 Results & Reported Figures |
|---|---|
| Attributable Gold Production | 5.9 million ounces |
| Gold All-In Sustaining Costs (AISC) | $1,358 per ounce |
| Total Operating Cash Flow | $10.3 billion |
| Free Cash Flow (Company Record) | $7.3 billion (record performance) |
| Total Shareholder Returns | $3.4 billion returned to shareholders |
| Corporate Debt Reduction | $3.4 billion paid down |
| Year-End Net Cash Position | $2.1 billion net cash |
The run continued into the second quarter of 2026. Production for the quarter was about 1.3 million ounces. Free cash flow reached $2.2 billion, which is a record for any second quarter in Newmont’s history.
Meanwhile, the average gold price the company realized went up 33% year over year and stood at $4,414 per ounce, down from $4,900 in the first quarter. All-in sustaining costs also came in at $1,621 per ounce, below the full-year guide.
The first half was still. In the first quarter, free cash flow came to $3.1 billion, the highest the company has ever reported.
As for the second quarter, adjusted earnings were about 47% higher at $2.10 per share. In addition, revenue in that quarter was $6.12 billion.
🔗Earnings Per Share (EPS) Explained
If we add the two quarters together, free cash flow for the half was about $5.3 billion.
Investment Takeaway: When gold prices are high, Newmont is good at turning them into cash. That money is now paying for buybacks and dividends, and it keeps the balance sheet in net cash.
Why 2026 Is a Planned Trough
Here the thesis gets more complicated. For 2026, Newmont expects to produce about 5.3 million ounces, compared with 5.9 million the year before.
Costs are heading the other way, however. The company’s guidance puts gold by-product AISC at about $1,680 per ounce.
🔗How to Read an Earnings Report
According to management, 2026 is a trough the company planned for, and growth should come back from 2027.
Newmont Production & Cost Outlook
| Operating Metric & Production Category | 2025 Actual Performance | 2026 Company Guidance |
|---|---|---|
| Attributable Gold Production | 5.9 million ounces | About 5.3 million ounces |
| Gold All-In Sustaining Costs (AISC) | $1,358 per ounce | About $1,680 per ounce |
| Managed Operations Production Breakdown | Not explicitly split in 2025 actuals | More than 3.9 million ounces |
| Non-Managed Operations Production Breakdown | Not explicitly split in 2025 actuals | About 1.4 million ounces |
The non-managed ounces come largely from Nevada Gold Mines, the joint venture Barrick operates. That share sits outside Newmont’s direct control.
Costs there are also rising. Nevada AISC climbed 13% from the first quarter to $1,805 per ounce.
The decline has clear causes. First, Newmont sold six higher-cost mines after buying Newcrest in 2023.
It also faces lower grades at several sites. Fewer ounces at higher unit costs is the trade-off for a cleaner, longer-lived portfolio.
Seismic events at Cadia also cut second-quarter output, although operations were back to normal by mid-June. Cadia is the flagship block cave mine Newmont acquired with Newcrest.
Even so, any repeat would test the caving strategy that underpins the company’s growth plans.
Investment Takeaway: Gold prices off their peak are now meeting a production dip. The Newmont stock price depends on 2027 growth arriving on schedule.
Shedding Mines to Build a Tier-One Core
Over 2024 and 2025, Newmont changed the shape of its mine portfolio quite a lot. It all started in November 2023, when the company closed its purchase of Australia’s Newcrest Mining.
The strategy that followed targets Tier-1 assets: long-life mines in the lower half of the global cost curve.
To fund that focus, Newmont sold mature, higher-cost operations across three continents. Those sales generated $3.6 billion of proceeds in 2025.
Newmont Asset Divestment Program
| Divested Mining Asset / Project Interest | Acquiring Counterparty / Buyer |
|---|---|
| Telfer Mine & Havieron Project Interest | Greatland Gold PLC |
| Akyem Gold Mine (Ghana) | Zijin Mining Group Co., Ltd. |
| Cripple Creek & Victor (CC&V) Mine, Colorado | SSR Mining Inc. |
| Éléonore, Musselwhite & Porcupine Operations | Canadian mining acquiring entities |
The sale of Akyem to China’s Zijin carries a geopolitical signal. Indeed, Chinese mining companies have been growing their presence in West Africa for some time.
In contrast, the large Western miners are putting more of their capital into countries they see as stable.
Investment Takeaway: With fewer but better mines, the portfolio carries less risk over the long term. It also means each core asset matters more to the Newmont stock price.
The Cash Machine and Capital Returns
This is where the windfall becomes shareholder value. By the end of the second quarter, Newmont had $9.0 billion in cash.
🔗Stock Buybacks Explained
After subtracting its debt, it still held $3.4 billion in net cash. On top of that, the number of shares has dropped by more than 100 million since February 2024. That is about 9% of shares outstanding.
Newmont Capital Return Program & Balance Sheet Liquidity
| Capital Return Marker & Financial Metric | Detail & Balance Sheet Figure |
|---|---|
| Quarterly Dividend Distribution | $0.26 per share |
| Authorized Share Buyback Program | $6.0 billion total authorization, with $4.3 billion remaining |
| Share Count Reduction (Since February 2024) | More than 100 million shares retired (approx. 9% reduction) |
| Total Cash & Cash Equivalents (June 30, 2026) | $9.0 billion |
| Net Cash Position (June 30, 2026) | $3.4 billion net cash |
Chief financial officer Brian Tabolt said Newmont returned more than 80% of free cash flow. In fact, it did so in two consecutive quarters.
In 2025, Moody’s raised Newmont’s rating to A3 and pointed to the stronger balance sheet as the reason.
Then, in February 2026, management introduced an updated framework for how it allocates capital.
The idea is to keep paying shareholders through good and bad commodity cycles, while the balance sheet stays flexible.
In our view, buying back shares at scale during peak prices is a double-edged choice. It rewards holders now. It also deployed cash while the stock traded closer to cycle highs than it does today.
Investment Takeaway: Capital returns support the Newmont stock price. However, their pace will depend directly on the gold price.
How Gold Prices Drive the NEM Stock Price
Shares of gold miners usually move more than gold itself, and the reason is operating leverage. In simpler terms, a miner’s costs stay fairly fixed, while its revenue goes up and down with gold.
🔗Gold Stocks vs ETFs vs Physical Gold: Which Belongs in Your Portfolio?
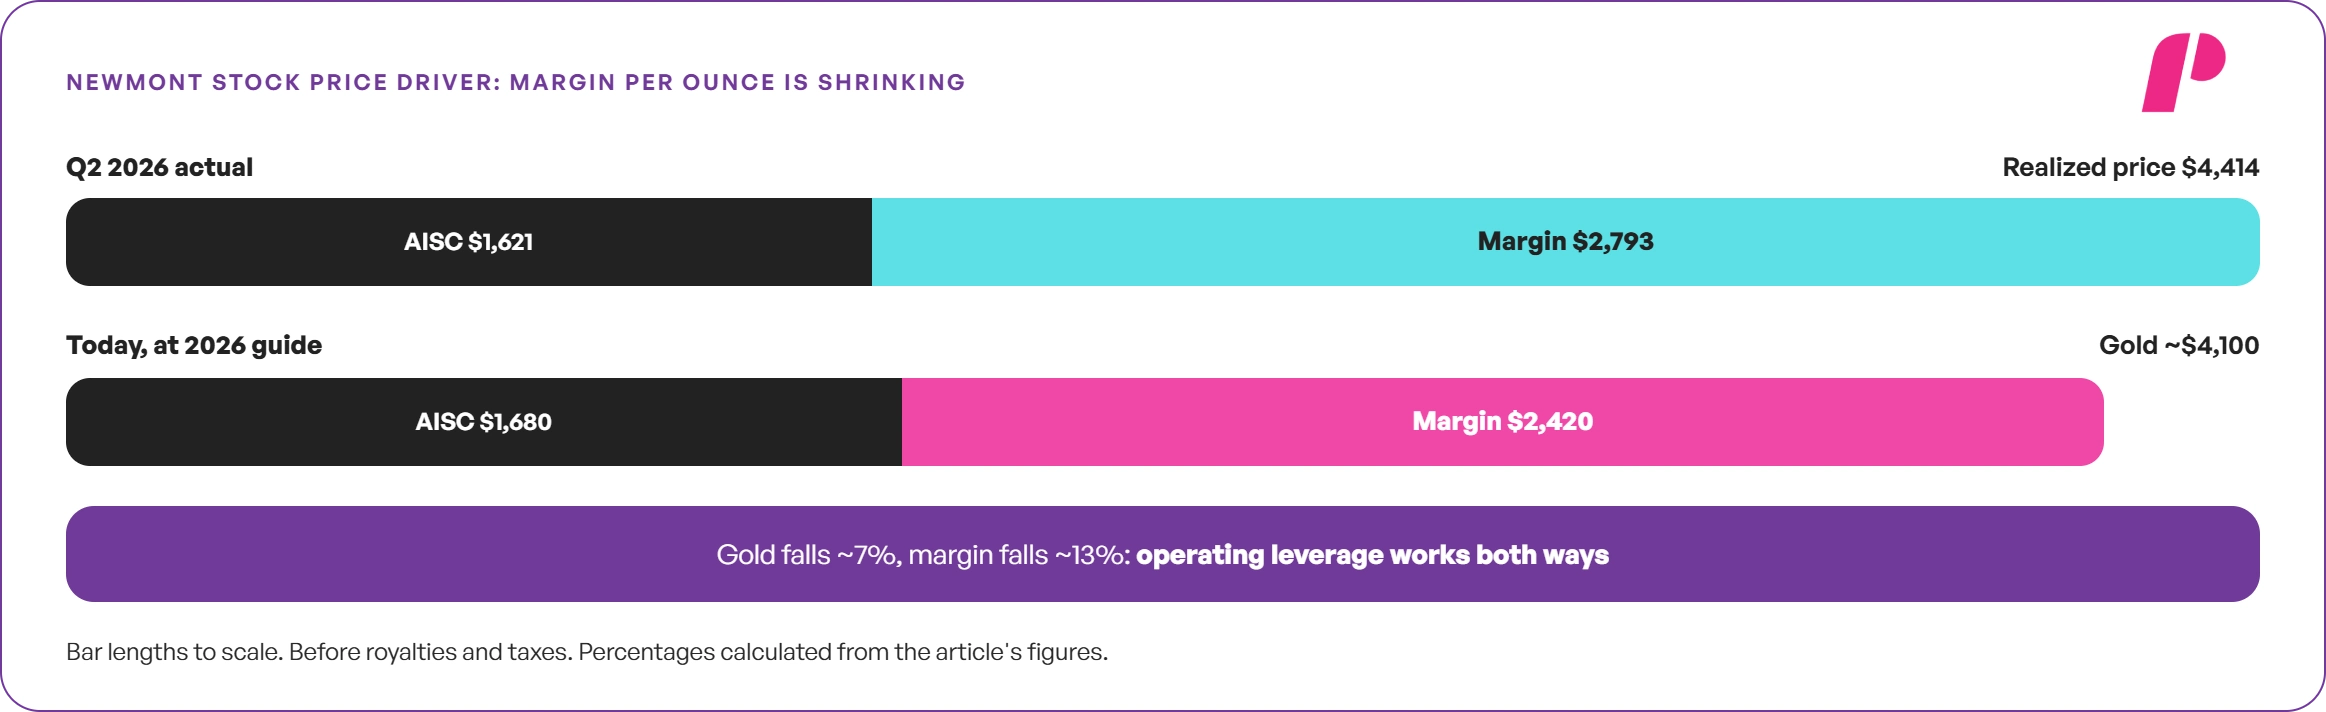
What’s happening should be self-evident by now when gold prices rise. The margin per ounce, calculated as price less AISC, grows fatter.
Free cash flow goes up sharply as well. As a result, there is more money for buybacks and dividends, and for paying down debt.
The market, in its wisdom, values the NEM stock accordingly. Put simply, this is how a higher gold price finds its way into the share price.
A simple formula captures the effect:

Take the second quarter as an example: the realized price was $4,414, and AISC was $1,621. That leaves a margin of about $2,793 on every ounce. However, at today’s gold price of about $4,100 and the $1,680 AISC guide, that margin shrinks to about $2,420.
Next, consider a $100 move in the gold price, applied to 5.3 million ounces a year. Revenue would change by about $530 million.
Keep in mind, however, that this is before royalties and taxes are paid. Both of them take a bigger amount as the price goes up.
Investment Takeaway: Leverage is what makes miners attractive when gold rises; however, it also works the other way. Gold prices decline, margin declines outpace revenue declines, and margins collapse first.
There’s a parallel structure to follow here.
Geopolitics and the Sovereign License
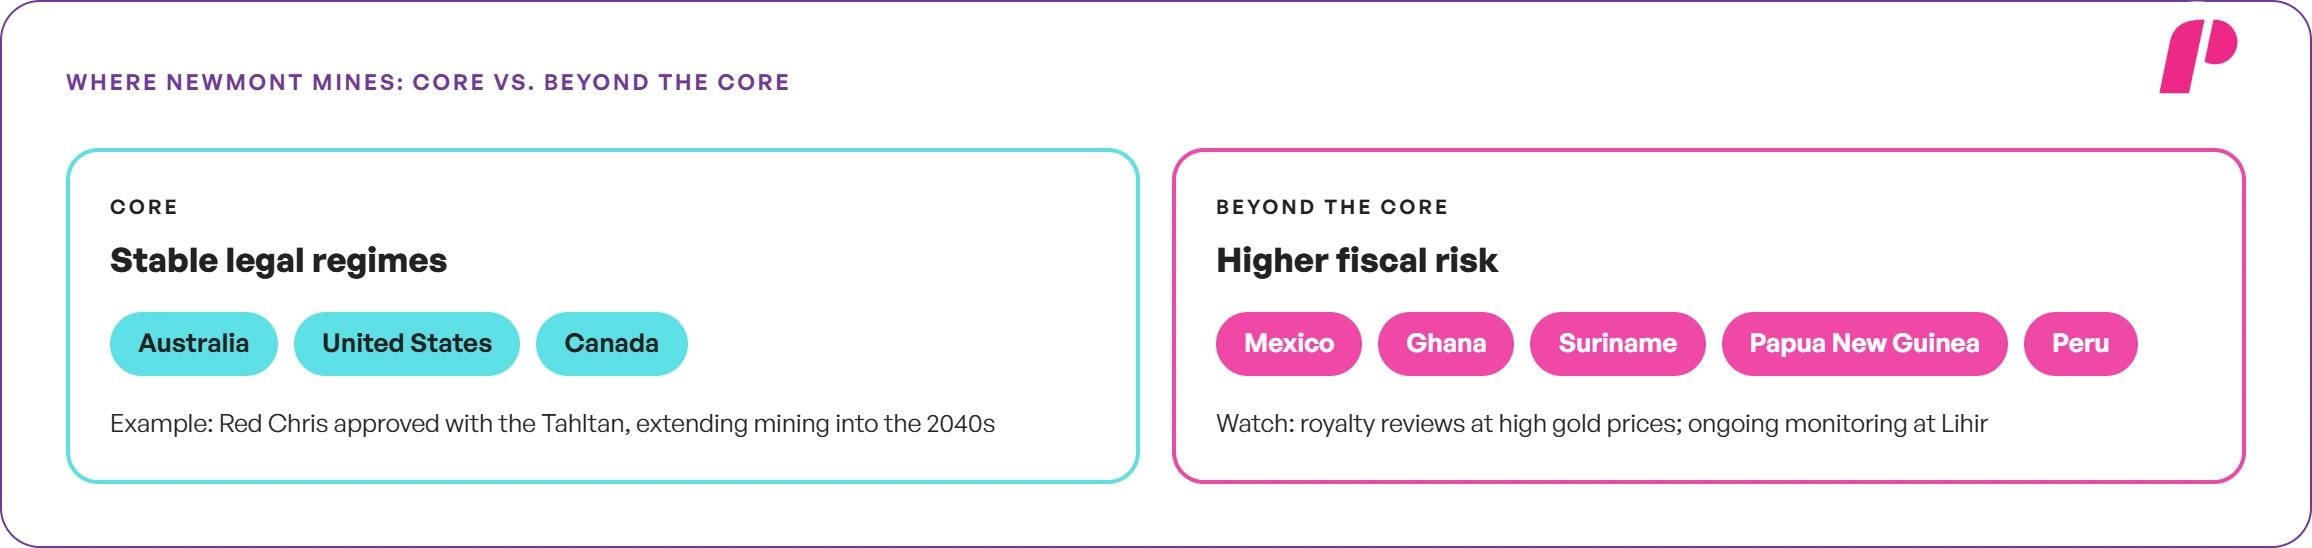
Newmont operates across very different legal regimes. Its core sits in Australia, the United States and Canada.
Beyond that core, Newmont has operations in Mexico, Ghana, Suriname, Papua New Guinea and Peru.
Every one of these countries has its own rules on royalties and permits. The relationship with local communities also differs from place to place.
For example, British Columbia offers a positive model. In June 2026, the province approved the Red Chris block cave amendment.
The review ran jointly with the Tahltan Central Government. It used Section 7 of the province’s Indigenous rights law. The project should extend mining into the 2040s and lift Canada’s copper output by about 15%.
By contrast, emerging-market mining projects come with higher fiscal risks than any other kind. In at least one major gold producer, government policymakers began reviewing royalties as gold prices rose.
In Papua New Guinea, the Lihir mine is another case, since it needs environmental monitoring on an ongoing basis.
Investment Takeaway: When approvals are built on consent, as at Red Chris, projects are less likely to be delayed. Rising royalties remain the main sovereign threat to the Newmont stock price at high gold prices.
Leadership and Copper Optionality
On January 1, 2026, Natascha Viljoen took over as Newmont’s president and chief executive officer.
By training, she is an extractive metallurgist, and before joining Newmont, she ran Anglo American Platinum. Her processing background suits Newmont’s complex autoclave and flotation plants.
Copper also adds a second engine. Cadia and Red Chris give Newmont large copper reserves.
🔗Copper Stocks Explained
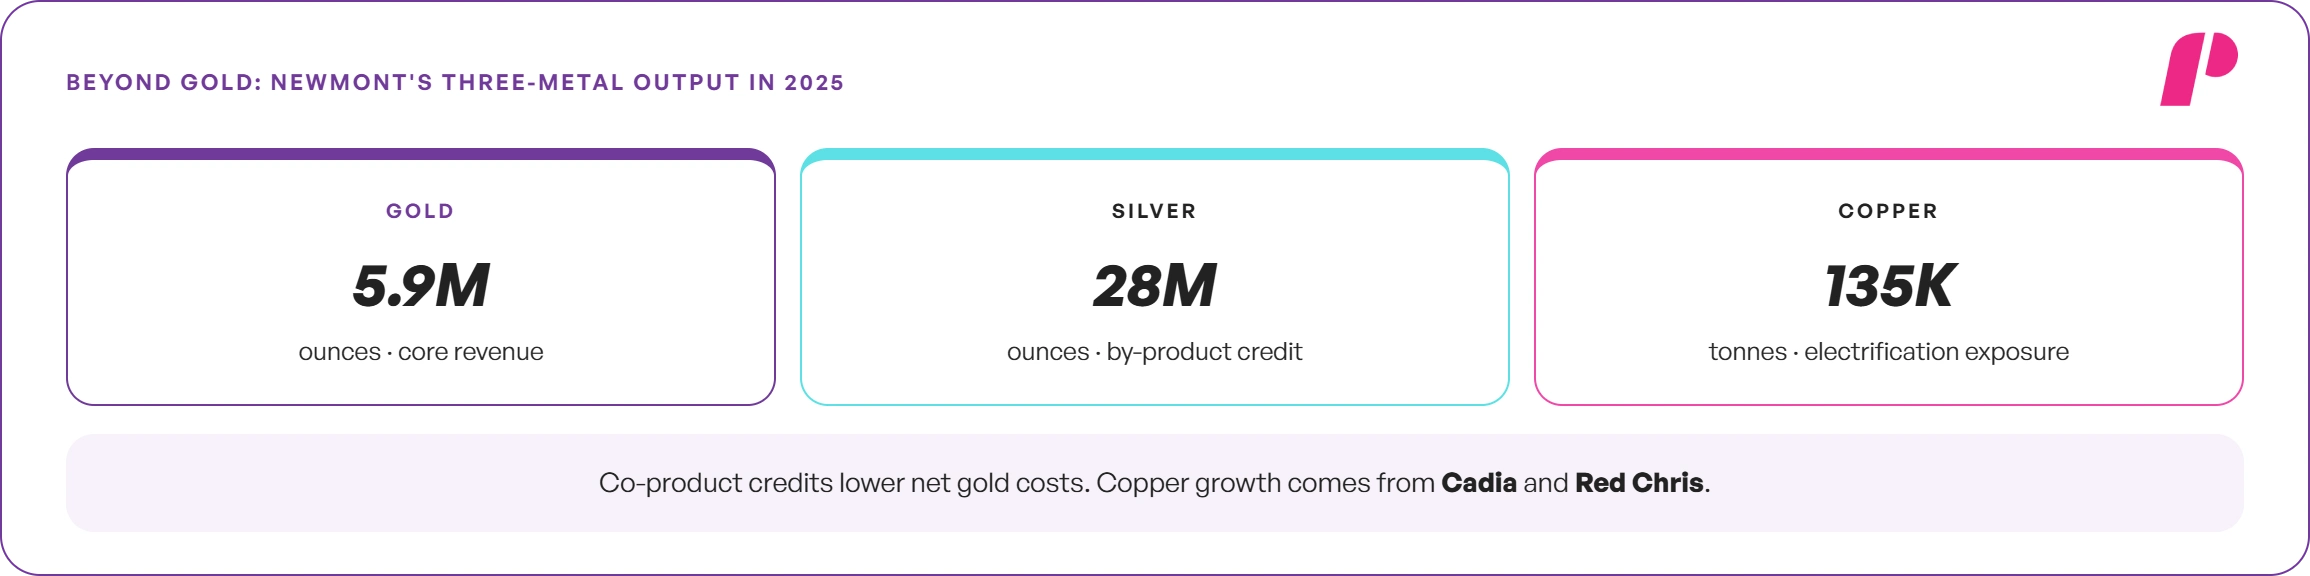
And here’s something worth remembering: 135 thousand metric tons of copper alongside 28 million ounces of silver in 2025.
Copper and other co-products generate credits that lower net gold costs. They also add exposure to electrification demand.
In our view, copper is the most underrated part of the Newmont story. This is the dynamic that makes sense behind the gold-copper combination: if gold goes soft, the copper earnings provide cover for those margins.
The investing lesson: It’s the diversification factor. The cash flow doesn’t rest on one commodity anymore. It turns a pure gold bet into a broader metals platform.
Patents: Capital Barriers, Not IP
In our view, copper is the most underrated part of the Newmont stock price story. This is the dynamic that makes sense behind the gold-copper combination: if gold goes soft, the copper earnings provide cover for those margins.
The investing lesson: It’s the diversification factor. The cash flow doesn’t rest on one commodity anymore. As a result, it turns a pure gold bet into a broader metals platform.
Patents: Capital Barriers, Not IP
A widely shared analysis credits Newmont with two foundational pressure-oxidation patents.
However, patent records show otherwise. US 4,738,718 belongs to Freeport Minerals, and US 4,578,163 belongs to Homestake Mining.
Instead, Newmont’s real intellectual property lineage is older and long expired.
Newmont Corporation Historical Metallurgical Patents
| Newmont Patent Number | Issue Year | Metallurgical Subject & Gold Processing Technology |
|---|---|---|
| US Patent No. 4,038,362 | 1977 | Gold recovery methods from carbonaceous ores |
| US Patent No. 4,259,107 | 1981 | Gold extraction and recovery from sedimentary ores |
| US Patent No. 5,127,942 | 1992 | Microbial treatment innovations for refractory gold ores |
The real moat is capital, not patents. Building an industrial autoclave complex requires a very large investment. Therefore, few juniors can replicate Newmont’s processing hubs.
🔗Patent Portfolios and IP Moats
Investment Takeaway: Newmont’s advantage lies in scale and processing infrastructure. Investors should not value it on patent protection.
The Risks That Matter
- Gold Price. Gold already trades more than 25% below its January record. If it remains weak for several months, margins get squeezed, and the company would probably buy back fewer shares.
- Production Trough. 2026 output falls to about 5.3 million ounces.
- Rising Costs. Management guides AISC up to about $1,680 per ounce.
- Seismic Risk. Cadia’s block cave suffered seismic disruption in 2026.
- Royalty Pressure. Host governments may seek larger shares at high prices.
- Execution. Red Chris and other caving projects must deliver on time.
- Rates. Higher yields reduce gold’s appeal as a non-yielding asset.
🔗Risk Management in Stocks: A Complete Guide 2026
Trading the NEM Stock Price Around October 22
Newmont will release its third-quarter numbers on October 22, once the market has closed. To estimate the size of the reaction in the Newmont stock price, traders can rely on a simple formula:

Analysts expect another period of double-digit growth in earnings and revenue. Recent coverage has focused on weaker gold and rising Fed rate-hike bets instead.
As an illustration, assume the implied move is 6%. With the stock at $111.56, this gives an expected move of about $6.69 up or down.
Therefore, the range to watch runs from about $104.87 to $118.25. Replace that assumption with the live options figure before the report.
🔗Options Expected Move Explained
Newmont Corporation Equity Catalyst & Monitoring Framework
| Catalyst Signal & Metric | Where to Find / Data Source | Likely Effect on NEM Stock Valuation |
|---|---|---|
| Realized Gold Price | Official quarterly earnings release | Serves as the primary fundamental driver of operating margins and cash flow |
| AISC vs. $1,680 Guidance Target | Quarterly earnings reports and cost tables | Directly tests management’s operational cost discipline and inflation control |
| Cadia Mine Recovery Progress | Earnings conference call and operational updates | Measures progress and ongoing seismic risk mitigation at key assets |
| Share Buyback Execution Pace | Earnings release capital allocation tables | Signals corporate confidence and commitment to returning capital to shareholders |
| 2027 Production Growth Outlook | Earnings call guidance commentary | Determines whether 2026 production represents the cyclical low point for output |
Investment Takeaway: In this report, traders should look first at costs and at what management says about 2027. A beat on earnings matters less. However, a weaker realized price would test the rally.
🔗Swing Trading Risk Management
Valuing the Newmont Stock Price
Valuation Markers
Analysts lean positive on the Newmont stock price. RBC and UBS both raised their targets to $155 in September. Scotiabank holds $149 and Bernstein $144.
Barclays, however, holds a more cautious $124. At about 14 times trailing earnings, the market prices Newmont as a cyclical miner.
For context, Newmont earned $7.2 billion of net income in 2025, or $6.89 per share on an adjusted basis.
Valuation Markers & Market Metrics
| Valuation Marker & Financial Metric | Figure & Benchmark Comparison |
|---|---|
| Share Price Close (October 14, 2026) | $111.56 per share |
| 52-Week Trading Range | $76.05 to $135.29 |
| Total Market Capitalization | About $116.2 billion |
| Trailing Price-to-Earnings (P/E) Ratio | About 14.1x |
| Average Wall Street Analyst Target & Consensus | $137.48 per share (Buy consensus) |
| Analyst Price Target Range | $67.00 to $170.00 per share |
In our view, Newmont has built an advantaged model that can generate substantial cash through shifting commodity cycles. Still, the valuation rewards that only while gold stays high.
Investment Takeaway: The NEM stock price trades on gold first and execution second. Capital returns provide a cushion, not a floor.
The Bottom Line on the Newmont Stock Price
Newmont has turned peak gold into real progress. It sold weaker mines, eliminated net debt, and generated record free cash flow.
Most of that cash goes back to shareholders. Furthermore, copper and the consent-based approvals help make the business more durable.
🔗Analyst Price Targets Explained
What remains to be seen is whether Newmont can secure lasting value now that the gold cycle has started to cool.
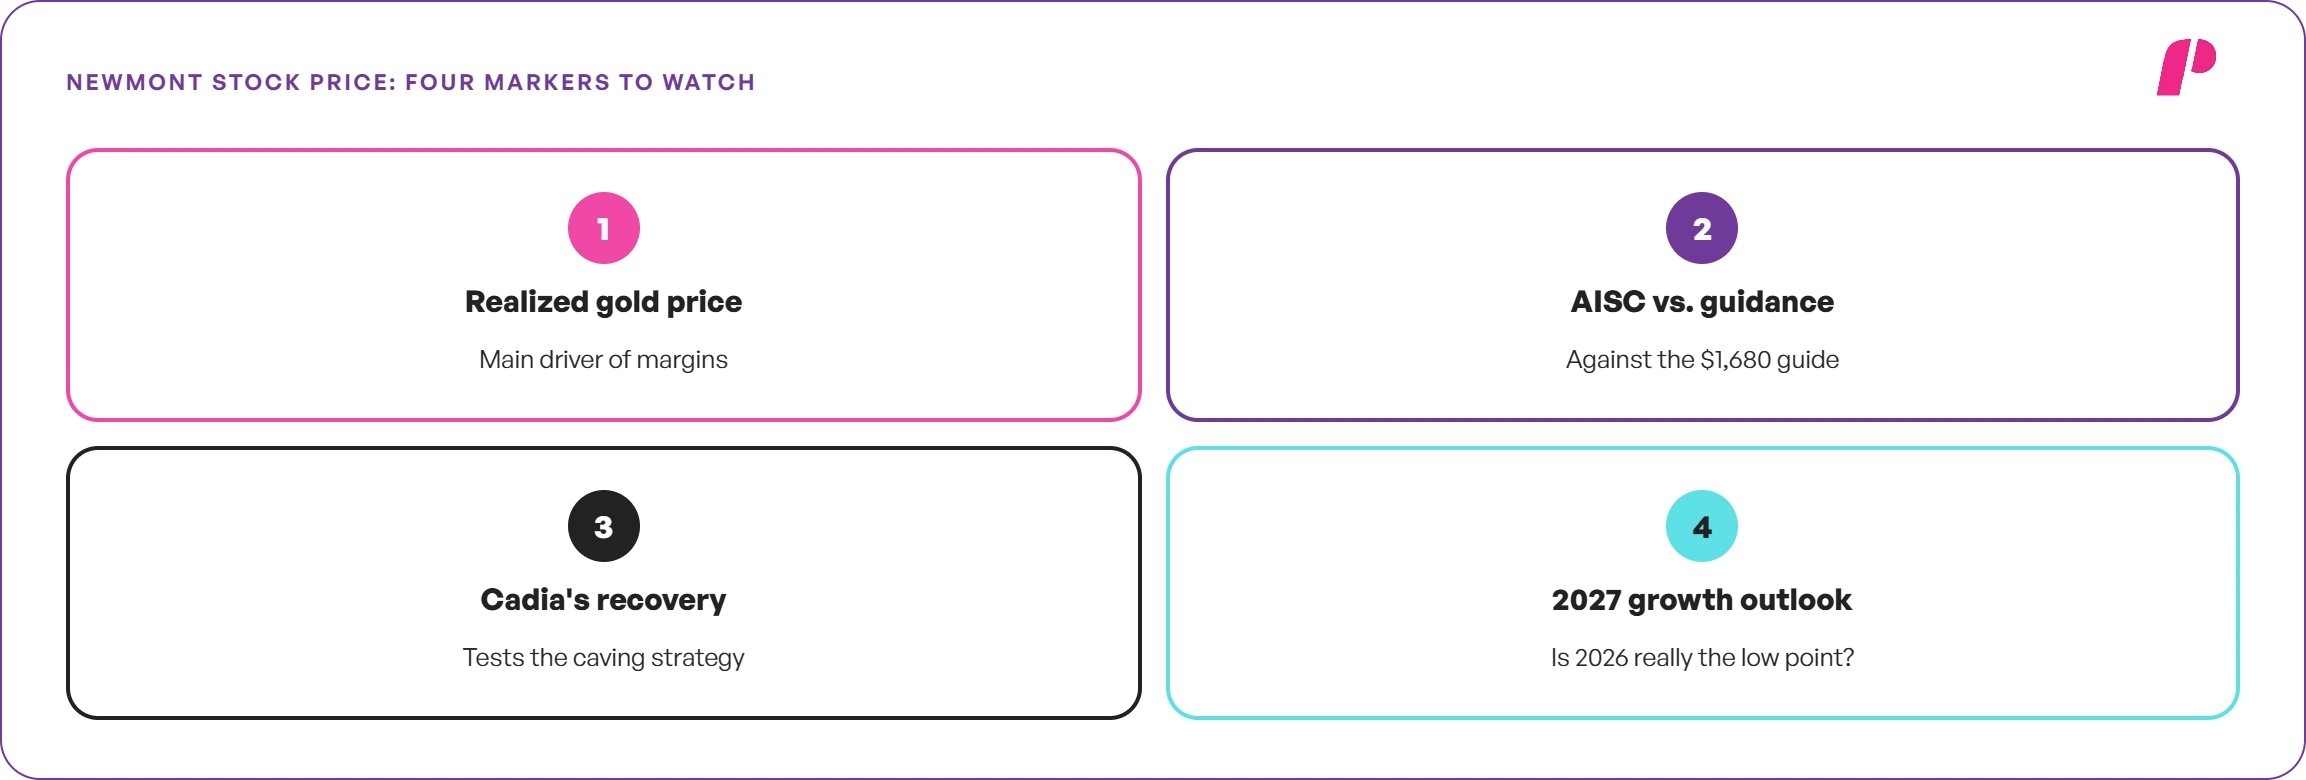
Watch four markers: the realized gold price, AISC against guidance, Cadia’s recovery, and the 2027 growth outlook.
In our view, Newmont is well placed to convert peak gold into lasting value. For the Newmont stock price, execution must hold through the production trough.
NFA. DYOR. This analysis is shared for information purposes, and readers should not treat it as investment advice. Calculations are hypothetical illustrations.
If you liked this post make sure to share it!