Microsoft plans to invest around $175 billion in capital projects during fiscal year 2027. This amount is even larger than what Microsoft earned in revenue for the whole of fiscal 2021.
As for the Microsoft stock price, it closed at $532.95 on Wednesday, October 21. Well, that is not very far from the highest level it has ever reached.
Simply put, investors are paying extra for Azure’s growth, even as the buildout keeps eating into free cash flow.
🔗Magnificent 7 Stocks: Where Investors Are Finding Growth in 2026
All of this will be tested today, Wednesday, October 28, when Microsoft reports its fiscal first-quarter results after the close.
Management has guided Azure growth to about 45%. The market will judge whether that acceleration justifies a spending curve that now rises faster than revenue. For traders, that turns tonight’s report into a volatility event, not only an earnings check.
Where the Microsoft Stock Price Stands Before October 28
The shares rose as much as 6% in October. They climbed from $512.90 at the end of September to a high close of $543.45 on October 13. They slipped to around $521 in Thursday trading.
Equity Valuation & Price Performance Benchmarks
| Valuation & Market Performance Metric | Figure / Financial Value |
|---|---|
| Closing Share Price (October 21, 2026) | $532.95 per share |
| Closing Share Price (September 30, 2026) | $512.90 per share |
| October Monthly High Close (October 13, 2026) | $543.45 per share |
| Wall Street Consensus Price Target (Early September) | About $573.00 per share |
| Forward P/E Ratio (Early September, at $499.70) | About 26.0x |
| Q1 FY2027 Earnings Report Schedule | October 28, 2026 (After Market Close) |
For a trader, these markers work as reference levels. The $543.45 October high and the $512.90 September close frame the area the report may test.
Analysts remain overwhelmingly bullish on the stock. According to 24/7 Wall St., by early September, 52 out of 55 analysts had rated it as a Buy or Strong Buy.
None of them rated it a Sell. Therefore, the question is not the quality of Microsoft, but how much its ambition costs.
🔗Analyst Price Targets Explained
Trader Takeaway: Bullish sentiment looks crowded. A guidance miss could hit the MSFT stock price harder than a beat would lift it. That’s because there are few buyers left to surprise.
Fiscal 2026: Record Profits, Shrinking Free Cash Flow
Microsoft closed fiscal 2026 with record results. Revenue went up by 18% and reached $331.8 billion.
Operating income increased by 21% to $155.2 billion. Also, for the first time, Azure revenue was more than $100 billion.
🔗Microsoft Earnings Reports 2026: Copilot, Nuclear AI & Security
Full-Year Financial Performance & Capital Allocation Metrics
| Financial & Operational Metric | FY2025 Results | FY2026 Results |
|---|---|---|
| Total Annual Revenue | $281.7 Billion | $331.8 Billion |
| Total Operating Income | $128.5 Billion | $155.2 Billion |
| GAAP Net Income Attributable to Shareholders | $101.8 Billion | $133.7 Billion |
| GAAP Diluted Earnings Per Share (EPS) | $13.64 per share | $17.95 per share |
| Cash Capital Expenditures (CapEx) | $64.6 Billion | $115.9 Billion |
| Free Cash Flow Generation | $71.6 Billion | $67.0 Billion |
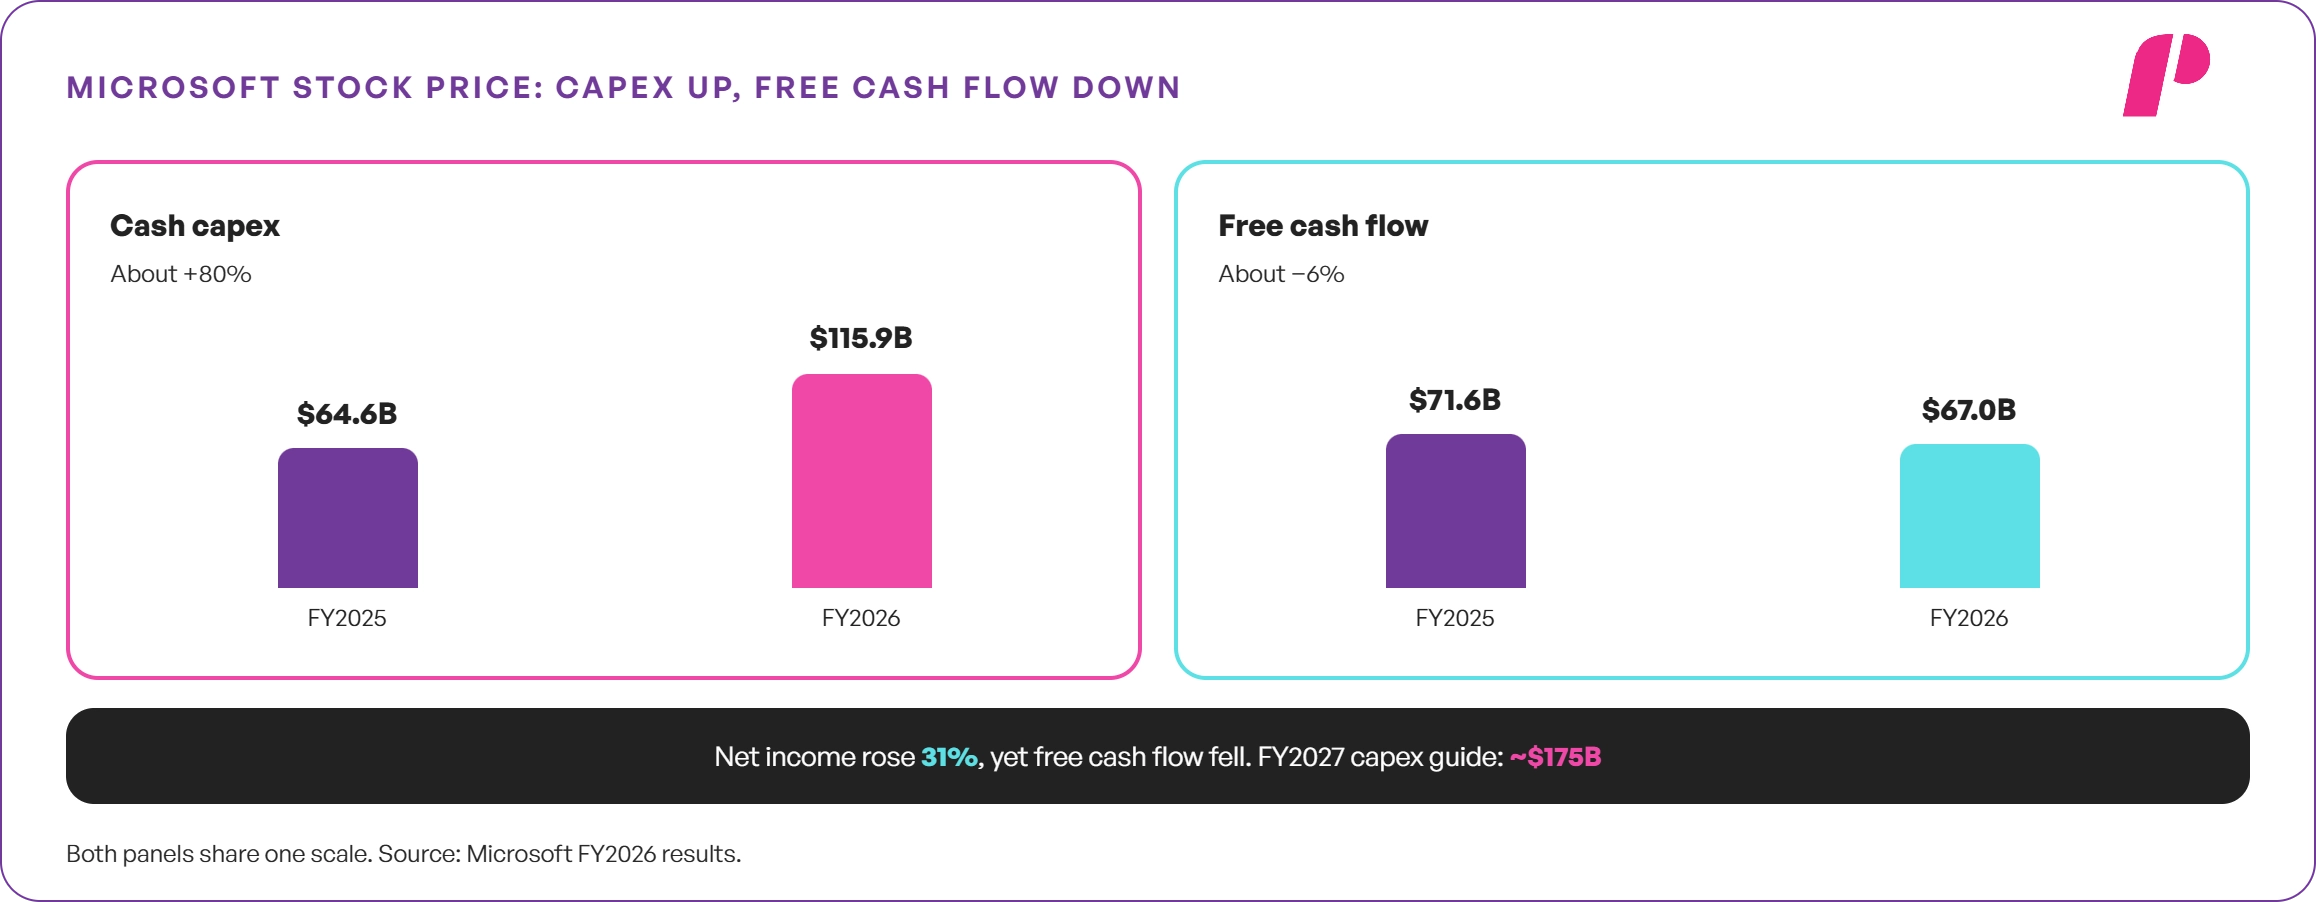
The last two lines tell the real story. Cash spent on property and equipment rose about 80%.
Free cash flow fell about 6%, even as net income jumped 31%. Microsoft now converts a shrinking share of its profits into free cash.
GAAP earnings also carry a non-operating boost from OpenAI-related items. When these items are excluded, on a non-GAAP basis, EPS increased by 22% to $17.28.
🔗Earnings Per Share (EPS) Explained
Trader Takeaway: It is important to follow free cash flow, not only EPS. If it declines again in fiscal 2027, the market’s patience with the buildout would be tested. In that case, an EPS beat may fade quickly in the next session.
How Capex Growth Affects Depreciation
Spending keeps climbing. In the fourth quarter, capital expenditures, including finance leases, came to $41 billion, a 70% increase year over year.
For the first quarter of fiscal 2027, management expects capex of over $50 billion. For the whole year, the expected figure is about $175 billion.
The composition matters as much as the size. About two-thirds of the fourth-quarter capex was spent on short-lived assets, mostly CPUs and GPUs.
The value of these chips goes down over a few years, and not over decades. CFO Amy Hood said about $25 billion of planned spending reflects higher memory and storage prices, not extra capacity.
🔗Nvidia Stock Analysis: Can NVDA Own AI, Robotics and Quantum?

The gross margin dropped to 67% compared to last year’s figures for the fourth quarter.
The operating margin is expected to fall by less than one percentage point for fiscal year 2027.
That guidance assumes Azure growth absorbs a depreciation wave that has barely started.
🔗Capex vs Depreciation: How Tech Spending Hits Margins
Trader Takeaway: Watch the cloud gross margin line tonight. A drop well below 67% would signal depreciation outrunning revenue. That detail can move the shares even on a revenue beat.
Azure’s Acceleration and the $678 Billion Backlog
The bull thesis is based on the fact that demand outpaces supply. Azure grew by 43% in the fourth quarter, from 40% in the third quarter.
Management guided first-quarter growth to about 45% in constant currency and expects acceleration through the first half.
Q4 FY2026 Financial Results & Cloud Growth Metrics
| Financial Metric / Business Segment (Q4 FY2026) | Reported Figure | Year-over-Year Growth Rate |
|---|---|---|
| Total Quarterly Revenue | $90.0 Billion | +18.0% YoY growth |
| Total Operating Income | $40.6 Billion | +18.0% YoY growth |
| Intelligent Cloud Segment Revenue | $39.3 Billion | +32.0% YoY growth |
| Azure & Other Cloud Services Growth | n/a (Growth Rate Basis) | +43.0% YoY growth |
| Total Microsoft Cloud Revenue | $59.3 Billion | +27.0% YoY growth |
| Commercial Remaining Performance Obligation (RPO) | $678.0 Billion | +84.0% YoY growth |
Commercial remaining performance obligation, or contracted backlog, almost doubled to $678 billion. That number needs context.
🔗Amazon Stock Price: Growth Strategies for Investors
Hood said commercial RPO rose 25% excluding OpenAI. One analysis estimates OpenAI accounts for roughly a third of the backlog. Microsoft has not disclosed the exact share.
A large part of Microsoft’s backlog depends on one customer that must itself keep raising capital. The next section explains why that concentration exists.
🔗Revenue Backlog (RPO) Explained
Seat growth offers a more diversified signal. In fact, Microsoft 365 Copilot has managed to secure over 30 million paying seats, and GitHub Copilot counts more than 50 million users.
🔗AI Stocks in 2026: How to Evaluate, Choose, and Trade
Trader Takeaway: If Azure ends up growing beyond 45%, the market is likely to read the capex strategy as justified. Any update on backlog concentration matters as much as the headline growth rate.
OpenAI: Partner, Customer and Investment
The backlog jump traces back to a deal signed a year ago. On October 28, 2025, Microsoft and OpenAI announced a new definitive agreement.
OpenAI contracted to buy an incremental $250 billion of Azure services. In exchange, Microsoft gave up its right of first refusal to supply OpenAI’s compute.
Microsoft & OpenAI Restructuring Agreement (October 2025)
| Restructuring Provision & Agreement Item (October 2025) | Contractual Term / Financial Detail |
|---|---|
| Microsoft Equity Stake (OpenAI Group PBC) | About 27.0% diluted equity interest (valued near $135 billion at signing) |
| Incremental Azure Compute Commitment | $250.0 Billion infrastructure purchasing agreement |
| Right of First Refusal on Compute | Removed (allowing multi-cloud infrastructure access) |
| Microsoft IP Licensing Rights | Extended through 2032 (structured alongside governance updates) |
The structure gives Microsoft three exposures to one company. OpenAI is a strategic partner, a major Azure customer, and a large equity holding.
🔗ARM Earnings Reports: Analyzing Q4 2026 Market Dynamics
Microsoft booked a $5.0 billion net gain from OpenAI-related items in fiscal 2026, which it excludes from non-GAAP results.
In our view, OpenAI’s ability to keep raising capital now matters directly to Microsoft’s revenue visibility. OpenAI can also buy compute from rival clouds, which caps Microsoft’s share of its future spending.
Trader Takeaway: View the $250 billion promise as earnings over several years, with risks associated with OpenAI. Therefore, any OpenAI funding headline can move the MSFT stock price, not only Microsoft’s own news.
Maia 300: Microsoft’s Answer to the GPU Bill
On October 12, Microsoft announced Maia 300, its next-generation custom AI chip. The company plans multi-gigawatt Maia deployments beginning in 2027.
Maia 300 will become the primary inference system for Microsoft’s own products, including Copilot, Teams, and GitHub.
Microsoft Maia 300 AI Accelerator Specifications
| Hardware Specification / Architectural Metric | Microsoft Maia 300 Performance Parameters |
|---|---|
| Advanced Semiconductor Process Node | TSMC N2P process (compute dies) |
| High-Bandwidth Memory (HBM) Capacity | 288 GB HBM4 configured across eight stacks |
| Aggregate Memory Bandwidth Throughput | 18.0 TB/s (2.5x performance increase over Maia 200) |
| Accelerator Density per Server Rack | 96 accelerators (double Maia 200 rack density) |
| Total Server Rack Electrical Power Draw | 167 kW power consumption |
| Maximum Supercomputer Cluster Scale | Up to 12,288 interconnected accelerators |
Microsoft claims up to seven times the rack-scale token throughput of Maia 200. Whenever an inference workload is moved from merchant GPUs to Maia, the capex budget becomes more efficient.
This approach is similar to what Google did with its TPUs; however, Microsoft starts later and at a smaller scale.
🔗Stock in Focus: Broadcom Stock (AVGO)
The chip also concentrates risk. Microsoft owns no fabrication plants and relies on TSMC to build Maia. In case of a disruption in Taiwan, its plans for custom chips would be affected directly.
Trader Takeaway: The benefits from Maia will only start in 2027. Near-term margins still depend on merchant GPUs and their pricing, so Maia is a story for later quarters, not tonight.
Power Is the Real Bottleneck
Money no longer limits Microsoft’s buildout. Electricity does. Two announcements in October show both sides of that constraint.
Data Center Power Infrastructure Developments
| Power Infrastructure Development / Project | Announcement Date | Contractual Detail & Grid Capacity Terms |
|---|---|---|
| NiSource Utility Agreement (Indiana, USA) | October 19, 2026 | Approx. 1,100 MW generation and 600 MW storage for 20 years, commencing in 2028 |
| Nscale Data Center Project (Loughton, UK) | October 18, 2026 | Microsoft withdrew participation; local grid officials projected power unavailable until the 2030s |
In Indiana, NiSource will add about 1,100 megawatts of generation for Microsoft’s campus. It will also contract 600 megawatts of battery storage.
Large-load customers pay in full for the infrastructure they need. NiSource says expected savings for its other customers rise to about $1.75 billion.
🔗AI Infrastructure Stocks: Power Players to Watch in 2026
In Britain, Microsoft pulled out of a data center deal with Nscale in Loughton, Essex. Nscale said grid officials told it the site would not receive power until the 2030s.
Nscale called it a London-wide grid issue and said it is exploring alternatives. Microsoft is learning to buy power directly where grids allow, and to walk away where they cannot deliver
That discipline protects returns but can slow capacity growth.
Trader Takeaway: Capacity, not demand, caps Azure growth today. Management commentary on new power contracts may matter as much as the revenue line on tonight’s call.
Gaming: The Segment Moving the Other Way
More Personal Computing revenue fell 4% in the fourth quarter. Severance costs in Xbox reduced EPS by about six cents, according to Constellation Research. Rising memory prices, driven by AI demand, now squeeze consumer hardware.
Fortune reported on October 20 that internal projections price the next Xbox console at $1,200 to $1,800.
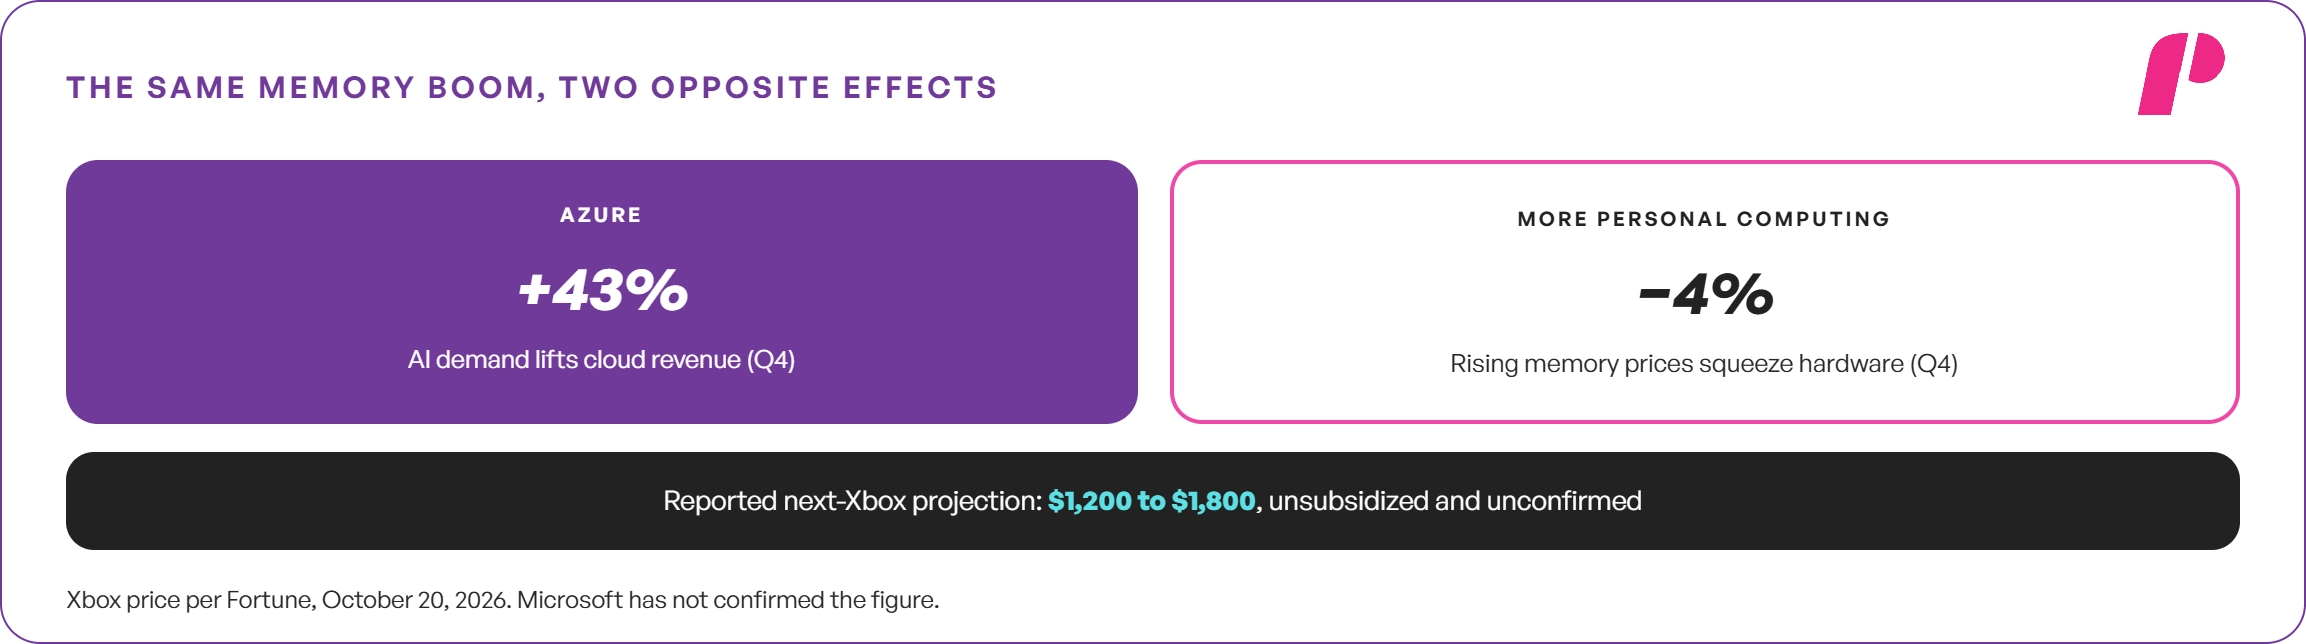
That assumes no subsidy. Microsoft has not confirmed the figure or decided on subsidies. The same memory boom that lifts Azure raises the cost of Microsoft’s consumer hardware.
Trader Takeaway: Gaming is too small to move the thesis. It can, however, add noise to segment results and margins, so a weak print there says little on its own.
What the Microsoft Stock Price Already Assumes
Valuation frames how much good news the shares already carry. The table compares the October 21 close with fiscal 2026 earnings, by our calculation.
Valuation Lens Analysis ($532.95 Share Price)
| Valuation Lens / Earnings Baseline ($532.95 Price) | Earnings Per Share (EPS) Basis | Implied Valuation Multiple |
|---|---|---|
| Trailing GAAP Diluted EPS (FY2026) | $17.95 per share | About 30.0x P/E multiple |
| Trailing Non-GAAP Diluted EPS (FY2026) | $17.28 per share | About 31.0x P/E multiple |
| Forward P/E Multiple Benchmark (Early September) | n/a (Consensus Multiple Basis) | About 26.0x forward multiple |
In simpler terms, at about 30x earnings, the shares already price in a strong quarter.
A premium multiple fits a company growing earnings above 20%. The risk lies in the cash conversion behind those earnings. In fiscal 2026, free cash flow went down, while net income increased by 31%.
This means investors pay a software multiple for a company that now spends money like a utility.
That combination can work for years if Azure keeps compounding. But it is less stable if the growth rate slows and depreciation keeps growing.
🔗Factor Rotation Explained: Value vs Growth Stocks
Trader Takeaway: The multiple will persist only as Azure continues accelerating into 2027. A deceleration would compress it quickly, even with record profits, which is why the price can drop on good results.
Trading the October 28 Report
For the first quarter, Microsoft expects revenue of $89.85 billion to $90.95 billion, which means growth of 16% to 17%. Azure should grow about 45% in constant currency.
Q1 FY2027 Forward Financial Guidance & Segment Projections
| Forward Guidance Metric / Business Segment (Q1 FY2027) | Projected Range / Financial Target |
|---|---|
| Total Quarterly Revenue Guidance | $89.85 Billion to $90.95 Billion |
| Intelligent Cloud Segment Revenue | $40.95 Billion to $41.25 Billion |
| Productivity and Business Processes Segment Revenue | $36.70 Billion to $37.00 Billion |
| Azure & Other Cloud Services Growth (Constant Currency) | About +45.0% constant currency growth |
| Cash Capital Expenditures (CapEx) Outlays | More than $50.0 Billion |
Traders can frame the event with an expected-move estimate.

🔗Options Expected Move Explained
The example assumes a hypothetical implied move of 5%. Traders should replace it with live options data before the report.

Earnings Scenario Planning & Price Action Triggers
| Market Scenario | Catalyst Trigger & Operating Metric | Possible Price Reaction & Technical Result |
|---|---|---|
| Bullish Scenario | Azure growth exceeding 45% with steady underlying cloud operating margins | Upside breakout above current trading range |
| Base Case Scenario | Azure tracking near 45% guidance and capital expenditures matching expectations | Sideways consolidation within established range |
| Bearish Scenario | Azure growth missing guidance or capital expenditures revised significantly higher | Downside breakdown below support range |
Position size should follow risk. If the account has a total value of $100,000 and is risking 1%, the amount at risk is $1,000.
In case the stop is one expected move away, the amount would be $1,000 ÷ $26.65, which would be approximately 37 shares.
🔗Position Sizing in Forex & Stocks
Trader Takeaway: The reaction of the market will mainly depend on Azure growth and capex guidance. Revenue and EPS beats are already expected.
The Risks That Matter for the MSFT Stock Price
Each risk below can show up as a specific line in tonight’s report or call.
- Capex Overrun. Spending rises faster than revenue, and free cash flow already fell in fiscal 2026.
- Backlog Concentration. OpenAI may account for roughly a third of commercial RPO.
- Depreciation. Short-lived GPU assets pressure cloud gross margins.
- Power Constraints. Grid delays can strand projects, as in Loughton.
- Foundry Dependence. Maia relies entirely on TSMC.
- Consumer Weakness. Gaming revenue and margins face rising component costs.
- Valuation. The MSFT stock price trades near its record, leaving little margin for error.
🔗Risk Management in Stocks: A Complete Guide 2026
Closing Thoughts
Microsoft has never made more profit, and it has never spent so much on capital. Azure growth is speeding up, and the backlog has almost doubled.
In addition, custom chips are expected to make inference cheaper from 2027. Free cash flow, however, is going in the other direction. Tonight’s report will show if growth is still ahead of the costs.
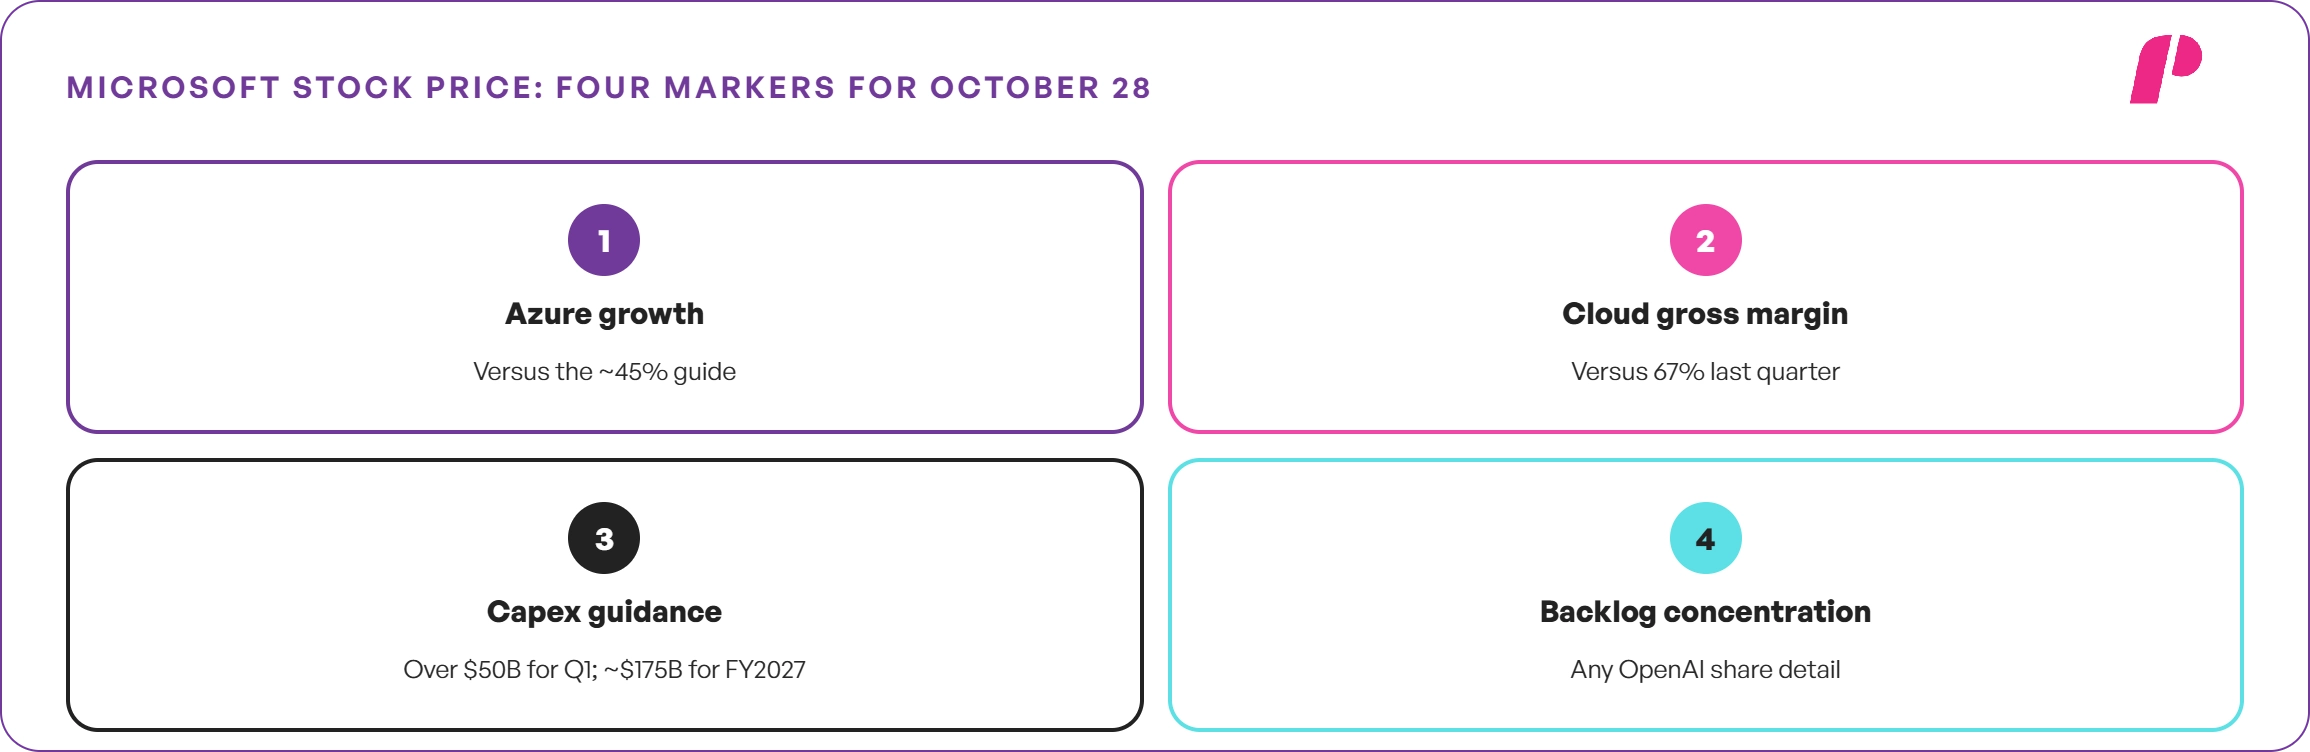
There are four markers to watch: Azure growth versus 45%, cloud gross margin, capex guidance, and any backlog concentration detail. In our view, Microsoft remains the strongest operator in enterprise AI.
The current Microsoft stock price, however, leaves little room for a quarter in which spending wins the race.
NFA. DYOR. This analysis is for informational purposes only and is not investment advice.
If you liked this post make sure to share it!