Enterprise value appears in earnings reports, takeover headlines, and stock screeners; however, only a small number of traders calculate it by themselves.
Most of them still estimate the size of a company based on its market cap, even though enterprise value provides a more complete picture. The fact is, market cap does not take into account the debt that a company owes or the cash that it holds today.
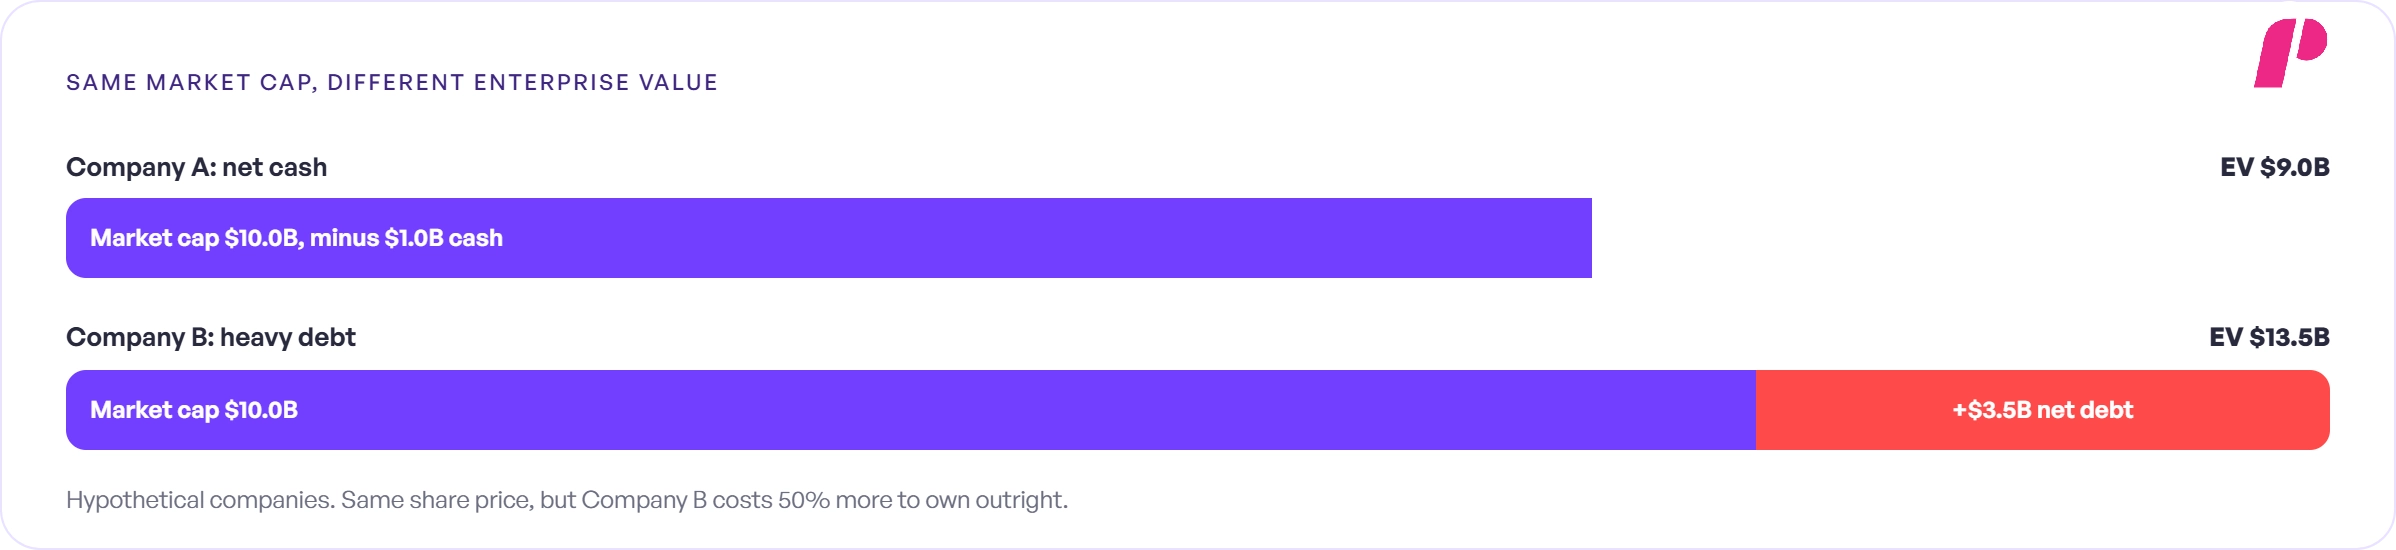
An illustration of this is two companies that both carry a market cap of $10 billion and yet differ a great deal underneath. One of them may hold more cash than debt, while the other one carries billions of dollars in loans and bonds.

As a result, the second company costs far more to own outright, even at the same share price. A trader who stops at market cap, therefore, may misjudge both valuation and risk before a trade.
Fixing this doesn’t require paid software: three numbers from a public filing and one formula are enough. In this guide, we will go through that formula step by step and then apply it to trading in a funded account.
🔗 What Is Market Capitalization?
Real-World Application And What EV Reveals
Most beginners, meanwhile, type one short question into Google long before they open a balance sheet: “What does enterprise value tell a trader that market cap cannot?” In simpler terms, it shows the value of the whole business, counting both debt and shares, after subtracting the cash on hand.
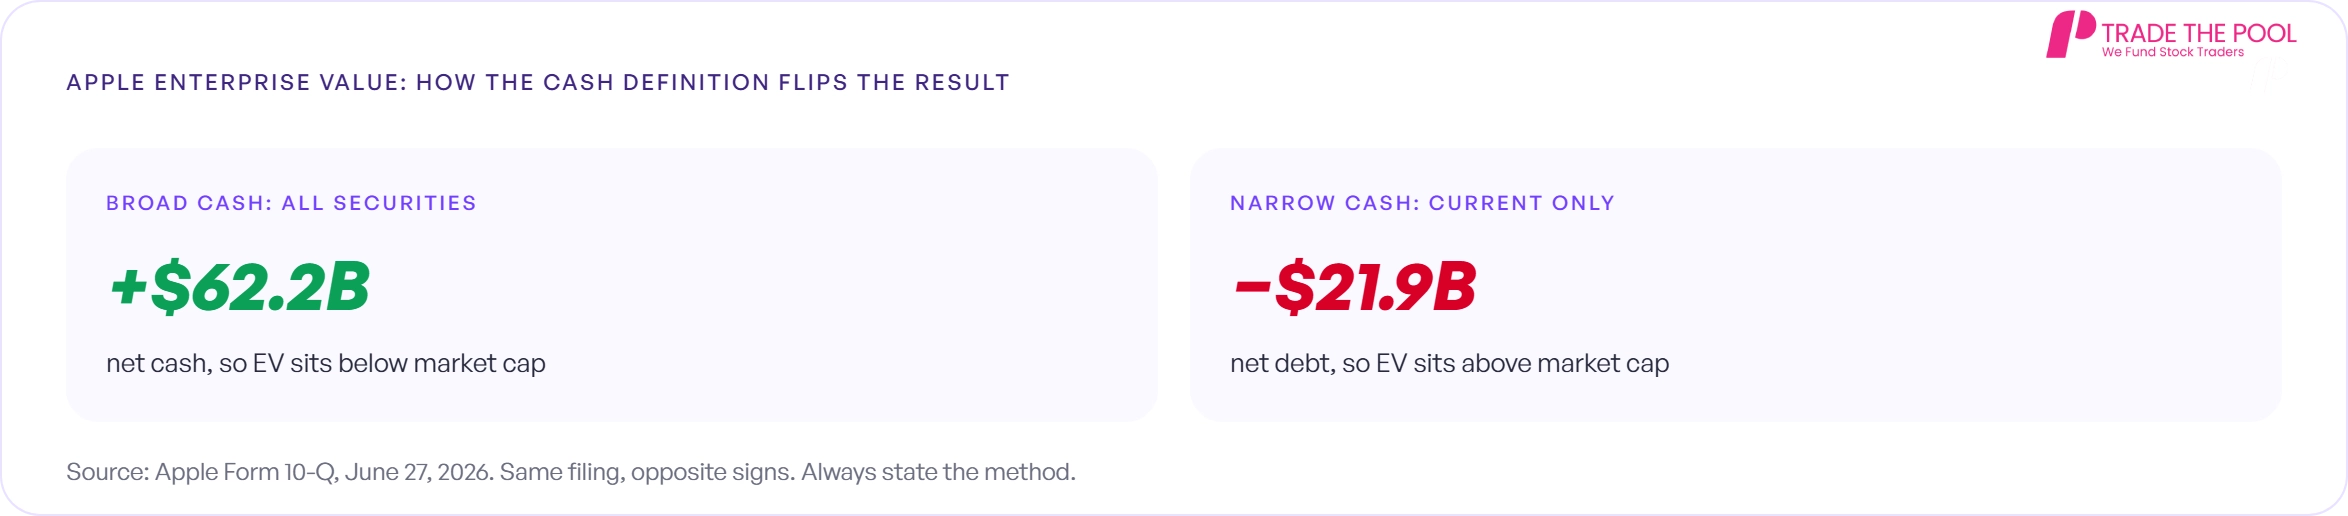
This idea becomes more concrete when we use real filings, and the balance sheet of Apple serves as one of the clearest examples. Data provided by Apple’s June 2026 10-Q has revealed that the company held about $62 billion more in cash and investments than in debt.
On the other hand, a narrower definition of cash changes those results, so every EV figure needs to state its method. In contrast to most guides, this article treats EV as a trading filter rather than a banker’s formula.
This article covers the comparison between EV and market cap first, followed by EV/EBITDA by sector and the cases in which a negative EV is no longer meaningful. The last section gives a balance-sheet checklist built for traders inside a funded stock account.
In This Article You’ll Learn:
- The meaning of enterprise value and the reason traders rely on it.
- The calculation of enterprise value, explained with a worked example.
- How EV differs from market cap and equity value.
- What a reasonable EV/EBITDA looks like by sector.
- How to use EV before an earnings trade.
What Is Enterprise Value?
Enterprise value measures the total value of a company’s operating business, including its debt, after taking out the cash. Beginners often ask: what is enterprise value, and why do analysts prefer it when they compare companies? The reason is that EV stays neutral to capital structure, according to Wall Street Prep’s 2024 guide, so differences in how companies are financed fade away.
Why Enterprise Value Counts Every Claim
EV tries to capture every major claim on the business, not only the claim of common shareholders. Readers often ask whether enterprise value includes preferred stock and minority interest in its full calculation. Yes: CFI’s full formula, for instance, adds preferred stock and minority interest, also known as non-controlling interest.

A Theoretical Takeover Cost
Because it counts debt, many guides describe EV as the full price a buyer would pay for the company. Hence the question: is enterprise value the exact price that a buyer would pay in order to acquire the whole business? Not quite: EV is only a theoretical takeover cost, and real deals usually add a premium and fees on top. That brings us to math itself.
Enterprise Value Formula And How To Calculate It
The Enterprise Value Formula
The calculation needs only three inputs, and each one appears in free public data for every listed company. So how do traders calculate enterprise value, and what is the enterprise value formula exactly? Nasdaq’s October 2024 guide, for example, adds total debt to market cap and then subtracts cash and cash equivalents.
🔗 What Are Shares Outstanding?
The formula in its most basic form reads: Enterprise Value = Market Cap + Total Debt – Cash and Cash Equivalents
When considered in its full context, which includes the other claims against the business:
Enterprise Value = Market Cap + Total Debt + Preferred Stock + Minority Interest – Cash and Cash Equivalents
Hypothetical Example:
| Company | Market Capitalization | Total Debt | Cash & Equivalents | Net Debt Position | Enterprise Value (EV) |
|---|---|---|---|---|---|
| Company A | $10.0 billion | $0.0 billion | $1.0 billion | -$1.0 billion (Net Cash) | $9.0 billion |
| Company B | $10.0 billion | $4.0 billion | $0.5 billion | +$3.5 billion (Net Debt) | $13.5 billion |
Why Cash Is Subtracted
The subtraction step confuses many beginners, since cash seems like something that should add value, not reduce it. Many readers ask, “Why is cash subtracted from enterprise value when the company clearly owns it?” Well, a buyer could use that cash to repay debt; therefore, it lowers the real cost of owning the business.
Where To Find The Inputs
Once a trader knows where each number lives, finding the inputs takes only a few minutes. A frequent query raised by traders is where they can find the numbers needed to calculate enterprise value for a listed company.
Both the debt and the cash appear on the balance sheet of every 10-Q or 10-K, while the market cap comes from price data. With the formula in place, the next step is comparing EV with the other size measures.
🔗 What Is a Balance Sheet?
Enterprise Value Compared With Market Cap And Equity Value
The Main Differences Between Them
Traders frequently use all three of these measures in tandem, but each of them is an answer to a different question. The difference between enterprise value and market capitalization is what makes equity value important. Market capitalization and equity value are measures that do not take debt into account but only look at the stock.
Three Size Measures Compared
| Valuation Measure | What It Counts / Scope | Mathematical Formula | Best Analytical Use Case |
|---|---|---|---|
| Market Capitalization | Common shares only | Share Price $\times$ Shares Outstanding | Determining overall company equity size |
| Equity Value | Total shareholders’ claim | Market Cap (for a publicly listed company) | Executing price-to-earnings (P/E) multiple comparisons |
| Enterprise Value (EV) | The entire operating business | Market Cap + Total Debt – Cash & Equivalents | Comparing firms with dissimilar debt loads |
How Debt Changes Enterprise Value
Debt is the main reason EV and market cap move apart for two otherwise similar companies. Traders often ask how debt affects enterprise value when the share price stays exactly the same. Each extra dollar of net debt raises EV by one dollar; as a result, companies that borrow heavily carry higher EVs.
🔗 CoreWeave Stock: Backlog vs Debt
Apple and the Definition of Cash
Cash-rich companies show why the definition of cash matters so much, and Apple’s June 2026 10-Q is a good case. Why can a company’s enterprise value be lower than its market cap at times? Apple’s broad count gives $62.2 billion of net cash; however, counting only cash plus current securities leaves $21.9 billion of net debt.
🔗 Net Cash vs Net Debt Explained
Balance Sheet Breakdown
| Balance Sheet Item | Amount ($ millions, as of June 27, 2026) |
|---|---|
| Total Debt (Commercial Paper + Term Debt) | $84,344 million |
| Cash and Current Marketable Securities | $62,399 million |
| Non-Current Marketable Securities | $84,118 million |
| Net Cash (Counting All Marketable Securities) | +$62,173 million (Net Cash Position) |
| Net Debt (Counting Current Securities Only) | $21,945 million (Net Debt Position) |
Source: Apple Form 10-Q, SEC EDGAR. EV on its own is only a number, so the next section turns it into a ratio.
EV/EBITDA and Other Enterprise Value Multiples
What Is EV/EBITDA?
Enterprise value becomes most useful when traders divide it by a single profit measure. Questions that most people have about EV/EBITDA include defining what it is and the reason why analysts use it instead of the P/E ratio.
EV/EBITDA, simply put, is the ratio between EV and EBITDA, which stands for Earnings Before Interest, Taxes, Depreciation, and Amortization.
🔗 What Is EBITDA?
What Is a Good EV/EBITDA Ratio?
Traders then want a benchmark, because a multiple means very little without a relevant peer comparison. What is a good EV/EBITDA ratio for a stock, then? There is no single good ratio: Damodaran’s January 2026 data, for instance, ranges from 8.16 to 47.76 across the sectors in the “Cyclical Stocks in 2026” Table.
Sector Valuation Multiples
| Industry Sector | EV / EBITDA Multiple (January 2026) |
|---|---|
| Oil & Gas (Integrated) | 8.16x |
| Utility (General) | 13.73x |
| Total Market (Excluding Financials) | 16.95x (Market Baseline) |
| Retail (General) | 17.38x |
| Software (System and Application) | 24.48x |
| Semiconductor | 34.75x |
| Auto and Truck | 47.76x |
EV/EBITDA by sector, positive-EBITDA firms only. Source: Aswath Damodaran, NYU Stern, data as of January 2026.
Low Multiples and the Value Trap
A low multiple tempts many traders because, on a screener, it looks like a bargain. Many of them then ask: does a low EV/EBITDA mean that a stock is undervalued and likely to rise soon? Not necessarily. A low multiple can be a sign of value; however, it can also reflect a business that is shrinking, and for this reason, a trader has to check growth, debt, and sector norms as well.
🔗 Undervalued Stocks: Ratios, Value & Traps
Negative Enterprise Value and Other Limits
When Cash Exceeds Market Value
Breaking Into Wall Street’s 2024 guide shows where enterprise value breaks down, starting with unusually large cash piles. Readers often ask: can enterprise value be negative, and does that make the stock a free bargain? It can, but it isn’t free money.
A $30 million market cap, no debt, and $35 million in cash give an EV of negative $5 million, which may signal that the market expects the company to burn through its cash.

Why Banks Need Different Metrics
Banks are a second limit because, as CFI explains, interest makes up a major part of their revenue. So why do analysts avoid enterprise value for banks and most other financial companies? For a bank, debt works more like raw material than financing; consequently, Damodaran’s January 2026 data lists no EV/EBITDA for banks.
Estimates Behind Every EV Figure
Furthermore, analysts usually record debt at book value, since corporate bonds often lack reliable market prices. Apple’s June 2026 10-Q lists the notes at $82.3 billion at carrying value, but only at $71.2 billion at fair value.
Consequently, there is a certain amount of estimation behind every EV figure, even when the number on the screen appears to be precise. With the limits clear, we can apply EV to actual trading.

Using Enterprise Value In A Funded Stock Account
A Pre-Earnings Balance-Sheet Check
For funded stock traders, enterprise value works best as a quick filter before earnings, not as a trading signal. How do traders use enterprise value when they prepare a position around a scheduled report? For instance, they compare the EV/EBITDA with that of sector peers and note the amount of net debt behind the share price.
🔗 How to Read an Earnings Report
How Debt And Interest Costs Affect Earnings Risk
Debt plays a role in how the market receives the results too, since interest expenses come out before the shareholders see their share of profits.
On the other hand, rising interest expenses would not affect a firm with net cash as much as its peers that have debt on their books. Hence, a trader who analyzes net debt at first would be able to calculate positions prior to testing the stop loss on a single gap.
What Enterprise Value Cannot Tell A Trader?
Unlike a price chart, a balance sheet updates only once a quarter, so net debt stays fixed between filings. Some traders still ask whether enterprise value can predict where a stock will move after the next report. It can’t: EV describes what the market pays for a business today, not where the price goes next.
The Official Limits Can Be Found In The Program Terms
| Audit Check | What To Look For / Evaluation Focus | Why It Matters / Strategic Rationale |
|---|---|---|
| Input Dates Alignment | Share price date and SEC 10-Q filing date matching | Avoids distortions from mixing asynchronous financial data |
| Net Debt Calculation | Total debt minus cash and marketable securities | Reveals underlying balance-sheet solvency risk and leverage |
| Sector Multiple Comparison | EV/EBITDA multiple relative to industry peers | Prevents falling into value traps disguised as cheap stocks |
| Earnings Calendar Date | Next quarterly earnings report schedule | Plans and manages binary earnings gap risk |
How To Run An Enterprise Value Check In Four Steps
- Step 1 – Record the date and gather the following data: market capitalization, total debt, and cash.
- Step 2 – Determine the net debt and EV, specifying the way that cash was calculated.
- Step 3- Only compare the ratio to those companies in the same industry.
- Step 4- Note the date of the next earnings announcement and set up the trade with room for a possible gap.
🔗 What Is a Funded Stock Account?
What Traders Should Remember About Enterprise Value
Enterprise value provides traders with a more complete view than market cap, since it counts both debt and cash. Some readers still ask: is a higher enterprise value better when two companies trade at the same price? Not automatically; for instance, a heavy load of debt can raise the EV without adding any value to the business.
The core method remains simple: add the debt to the market cap, subtract the cash, and note the date of each number. Others ask which enterprise value multiples traders use most often together with the basic figure.
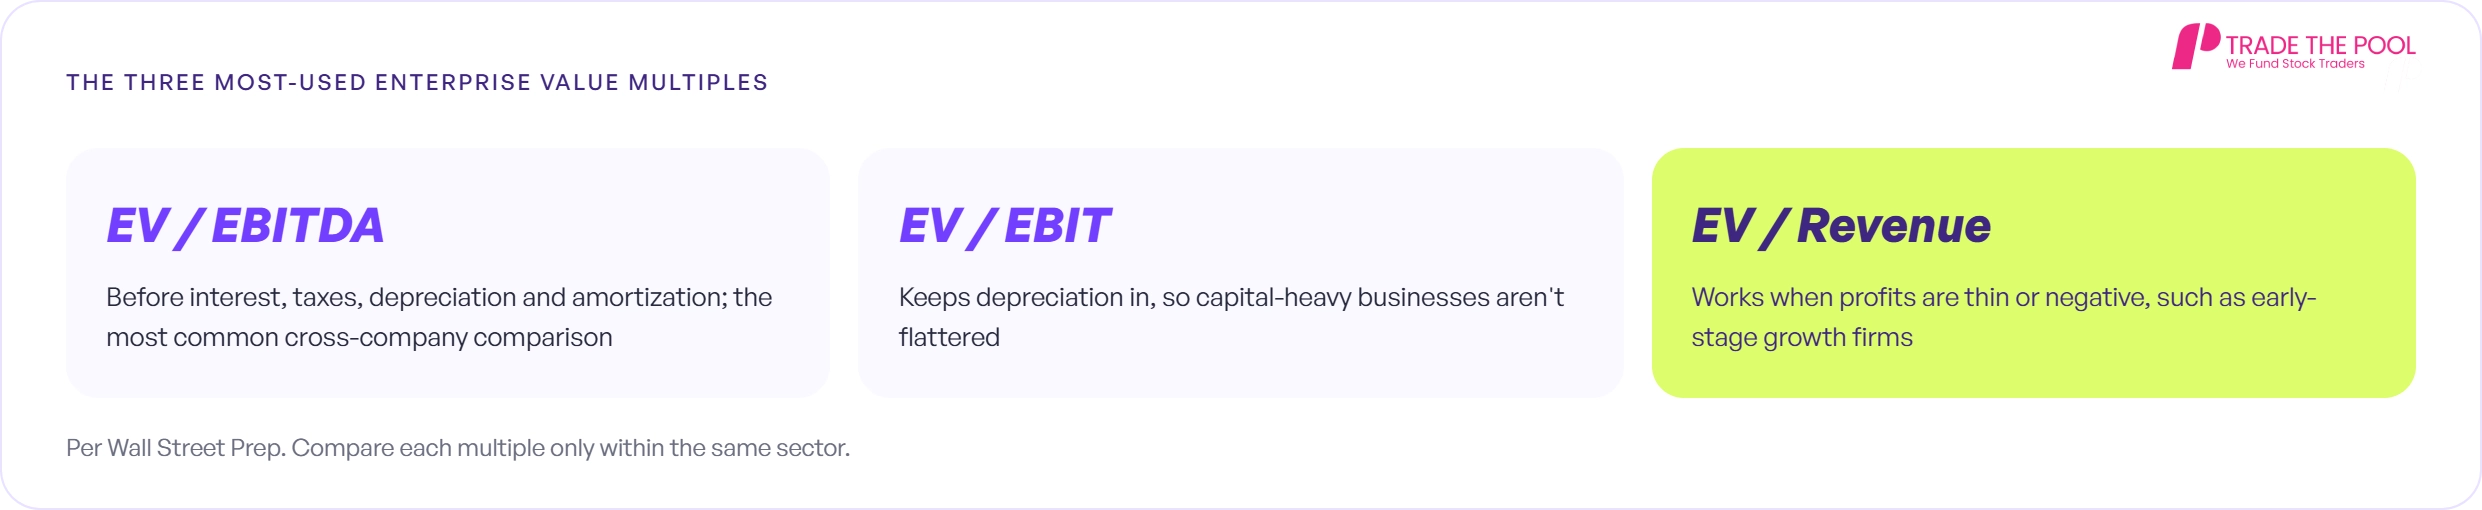
According to Wall Street Prep, the most popular valuation multiples include EV/EBITDA, EV/EBIT, and EV/Revenue; nevertheless, they all operate well only in their own sector.
Thus, the trader will be able to build a more stable picture of the firm by updating the EV at each filing. This approach is consistent with charting, earnings preview, and risk controls in a funded account.
It also turns a banker’s formula into a clear input that a trader can repeat before every new position. Traders who want to apply this check inside a funded account can explore the Trade The Pool funded stock program. Each trader should review the program rules first, then add this EV check to every pre-trade routine.
If you liked this post make sure to share it!