What are ICT Concepts? – Unlock Smart Money Trading

Empty promises and smoke and mirrors. A lot of traders in the confusing world of financial markets are on a tough search for a way to trade that really works. There are many ideas out there, and ICT has become a popular, though sometimes debated, one. If you’ve ever felt like the “smart money” is always after your stop losses, you’re not alone, and ICT concepts are what many traders are looking at. So, what’s ICT trading? It’s a specific, all-around way of trading created by Michael J. Huddleston, known as “The Inner Circle Trader.”It looks at how big institutions trade and focuses closely on price action.

The main goal? Finding trades with a high chance of winning by checking out how money moves in the market (liquidity), the market’s structure, and the usual patterns of how big players trade and sometimes even manipulate things. It doesn’t rely on typical indicators that follow trends or momentum (unless they come right from the price itself).

Key Notes

    • Understanding the Core ICT Concepts
    • What does ICT stand for?
    • What’s in ICT?
    • What is ICT vs retail trading?
    • What is Liquidity in ICT Trading?
    • ICT Optimal Trade Entry
    • How are Indicators Used in ICT Trading?
    • What is the best time frame for ICT trading?

Understanding the Core ICT Concepts

ICT trading concepts are all about understanding what the “smart money” institutions are planning by really looking closely at how prices move. These big players trade huge amounts, so they often need to nudge prices around to get enough orders filled.

To get a better handle on this and trade in line with them, ICT uses a set of key ideas. It looks at the market’s structure to see the overall picture, finds key spots where institutions likely placed orders (ICT concepts like order blocks), checks out areas where price moved quickly without much trading in between (ICT concepts such as fair value gap), and tries to figure out where prices might be heading. By getting good at these things, traders can better understand what the institutions are doing and hopefully make smarter trades using ICT concepts.

What does ICT stand for?—Exploring the Foundation of ICT Concepts

So, ICT? It’s just short for Inner Circle Trader. Sounds kind of cool, right? Michael J. Huddleston came up with it to show that his way of seeing the market is like having an “insider’s” view. The “Inner Circle” idea suggests you get to see what the big institutions are doing behind the scenes, which goes beyond what most regular traders know. Huddleston picked this name because he wanted to teach people to see the market the way the big guys do, focusing on core ICT concepts.

He figured that if you learn the ICT principles, you can really understand what makes prices move. And yeah, “ICT trading” has pretty much become the common term for this style – the one that’s super precise, figures out what the “smart money” is up to, and aims for those high-probability trades based on that insider info, all thanks to understanding ICT concepts. So, if you hear “ICT” in trading, it’s almost always about Michael J. Huddleston’s Inner Circle Trader method and its underlying ICT concepts.

What’s in ICT?

Alright, so what’s actually in the ICT toolbox? It’s a mix of connected ideas, tools, and tricks to help you really understand the market. One big focus is market structure – knowing the main highs and lows and where the market might be going. Then there are liquidity pools, which are like areas where a lot of stop losses or take profits are sitting, and big institutions often target these to fill their orders. Order blocks are key too; they’re price areas where big players likely put in orders and can act as future support or resistance. Fair Value Gaps (FVG) are like price imbalances that often get filled later.

ICT also uses Optimal Trade Entry (OTE), a way to find good entry points after a price pullback using Fibonacci levels. Plus, there are kill zones, specific times of day with more trading action. ICT sometimes uses indicators like the RSI in specific ways. It also looks at how different trading sessions (Asia, London, New York) can affect price. These ideas all fit together to give you a detailed way to look at the market like an institution.

What is ICT vs retail trading?

Okay, so the ICT way of trading is pretty different from regular retail trading. Here’s the lowdown:

  • How They See the Market: Retailers often use indicators and simple chart patterns, thinking the market has predictable rules. ICT tries to see what big institutions (“smart money”) are doing, focusing on price, market structure, and where the money (liquidity) is.
  • What Tools Do They Use? Retail often uses lots of indicators as signals. ICT looks mostly at price action, understanding market mechanics without many indicators.
  • Which Charts They Look At: Retail might stick to one timeframe. ICT looks at different timeframes to see the big picture and then zooms in for entries.
  • What They Think Drives the Market: Retail might think it’s just supply and demand or indicator signals. ICT believes big moves happen when institutions need to trade large amounts, sometimes even causing smaller moves to trick others or get liquidity.
  • What Ideas are Important to Them: Retail talks about support, resistance, and trends. ICT focuses on market structure shifts, order blocks, fair value gaps, liquidity, kill zones, and market maker patterns.


Liquidity in ICT Trading

What is Liquidity in ICT Trading? A Core ICT Concept

Alright, in ICT, liquidity is about those spots where a ton of buy or sell orders are waiting at certain price levels. These orders can be stop losses, take profits, or pending orders. It’s a big deal because institutions trade huge amounts and need these orders to fill their own without big price changes. They often look for areas with lots of liquidity. The ICT folks also think institutions might push prices towards stop losses to trigger them, getting the liquidity they need. ICT traders try to figure out where this liquidity is, often near highs and lows, as that can hint at where the price might go next.

Understanding ICT Optimal Trade Entry

Let’s break down OTE. It’s a really precise ICT way to find good spots to enter a trade after the price has made a big move and then pulls back. Think of it as a “sweet spot” using Fibonacci levels, usually between 62% and 79% of that initial move. This area is “optimal” because big players might add to their positions here after shaking out some traders. Just being in the OTE zone isn’t enough, though. ICT traders look for other clues (confluence) like price reacting to an order block or a fair value gap. When price enters this zone and looks like it’s going to continue in the original direction, that’s when you might enter. OTE helps you get into trades at a good price, which can mean better risk and reward. It’s a key part of many ICT strategies for high-probability setups.

What is an ICT optimal trade entry?

ICT optimal trade entry is just the full name for the ICT OTE strategy. It’s about using Fibonacci levels to find the best places to enter a trade after a price pullback.

What is the ICT OTE strategy?

The ICT OTE strategy is simply using the Optimal Trade Entry technique. OTE stands for Optimal Trade Entry, and it means finding that 62% to 79% Fibonacci zone and looking for other signs to enter a high-probability trade.

How are Indicators Used in ICT Trading

How are Indicators Used in ICT Trading?

When you get into ICT trading, you’ll see that the main thing is understanding price action and what the big institutions are doing. So, unlike other methods with lots of indicators, ICT usually keeps it simple. Indicators aren’t the main focus, but they can help confirm things if used correctly. For example, the Relative Strength Index (RSI) might be used to spot divergences when the price is at a key ICT level. You won’t find a special set of “ICT indicators.” Instead, ICT teaches you how to use common ones, like the RSI, in a way that fits with their ideas about price, market structure, and institutional trading.

What is the role of indicators in ICT Concepts?

In ICT, indicators are mostly used as a second check to confirm trading ideas you get from looking at price action, market structure, and liquidity. They’re not the main reason you’d take a trade, but they can add confidence to your analysis.

How does ICT view common indicators like RSI?

ICT often uses common trading indicators like the RSI differently than usual. Instead of just looking at overbought or oversold levels, ICT traders might look for things like divergences or if the RSI fails to break certain levels, especially when the price is at an important ICT spot.

Are there specific ICT indicators?

Nope, there aren’t really any indicators labeled just for ICT. Instead, the ICT method teaches you how to use regular indicators in a way that makes sense with their core ideas about how the market works. The main focus is always on understanding price and what the big institutions are doing.

What is the best time frame for ICT trading? Applying ICT Concepts

Experienced traders know the market looks different depending on whether you’re looking at the long-term or short-term. In ICT, they don’t say there’s one “best” timeframe. It’s more about looking at the market from different angles to get the full picture. The key is that the main ideas of how the market’s put together, where the big money is (liquidity), and what the institutions are doing seem to happen on any timeframe. So, the “best” one for you just depends on how you like to trade, what you’re trying to achieve, and how much time you have.

Getting the Big Picture: Market Bias and Key Levels (Daily, Weekly, Monthly)

Think of these as your main maps. ICT traders often start here to see where the market’s generally heading. They look for important highs and lows that big institutions are probably watching, along with key areas like major order blocks (where big orders were likely placed) and longer-term fair value gaps practice (spots price might revisit). This gives you the background info for your trades, showing you possible support, resistance, or targets.

Zooming In: Refining Structure and Finding Sweet Spots (4-Hour, 2-Hour, 1-Hour)

When you look at these timeframes, you see more details in the market’s moves. You can spot clearer signs of direction changes or breakthroughs in important levels. ICT traders often use these to find “sweet spots” – like smaller order blocks or fair value gaps that line up with what you saw on the bigger charts. These can be good places to start thinking about a trade.

Getting Down to the Nitty-Gritty: Timing Your Entries (15-Minute, 5-Minute, 1-Minute)

These are for getting your timing just right. Once you’ve found a potential area on the higher charts, you can zoom in here to find the best moment to get in. ICT traders might watch for specific price patterns or quick changes during the busiest trading times (killzones). If you like fast trading, like scalping, you’ll be on these charts more.

Putting It All Together: Your Style and the Market’s Rhythm

ICT also considers the time of day, especially those busy kill zones. But really, the timeframes you use most will depend on your trading style – whether you hold trades for minutes, hours, or days. The cool thing about ICT is that you can use its ideas for any of these. Just remember to start with the big picture and then narrow it down to find your entry.

Displacement in ICT Trading

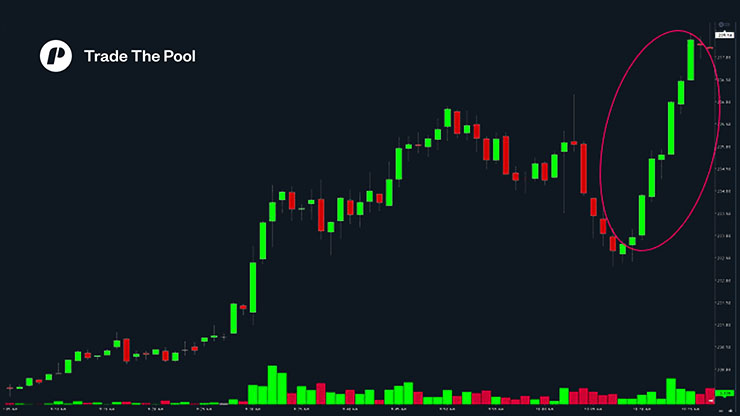
Understanding Displacement in ICT Trading

Displacement in ICT trading is when the price makes a strong, sudden move up or down. On a chart, this often looks like a bunch of long candles in a row, all going the same way with small wicks. ICT notes that there are two primary aspects of displacement: it typically signifies a significant increase in buying or selling, often when the price reaches a key liquidity point, and it almost always results in a Market Structure Shift and a Fair Value Gap.

Market Structure Shift

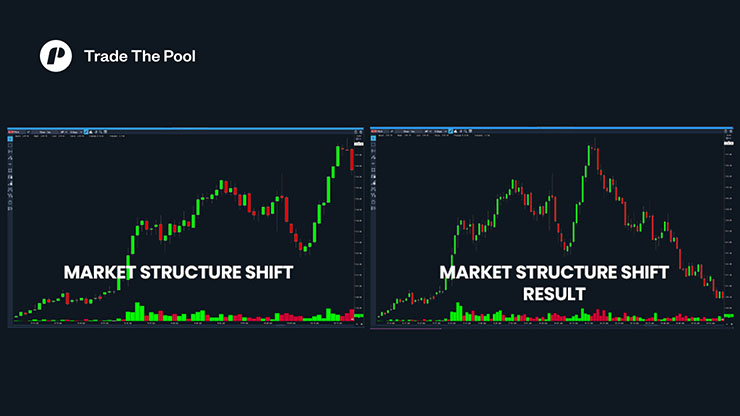
Understanding Market Structure Shift in ICT Trading: An ICT Concept

A “Market Structure Shift” (MSS) in ICT occurs when the current trend is disrupted. If it’s been going up (bullish), it’s when you see the lowest point of a lower low after a series of higher highs and higher lows. If it’s been going down (bearish), it’s the highest point of a higher high after lower lows and lower highs. ICT traders view an MSS as an early indication that the trend may be shifting, and if other factors confirm it, they often use this spot on the chart as a starting point for their trades.

Understanding Inducement in ICT Trading: Applying ICT Concepts

Inducements are price moves at the edges of small countertrends within a bigger trend. ICT traders believe these happen because “Smart Money” is hunting for stop-losses on the lower timeframes. The idea is that once the price reaches these inducement levels and captures that extra liquidity, it’ll turn around again and continue with the primary trend. ICT traders often plan their trades based on the belief that, after an inducement, the price will move in the direction of the long-term trend.

Understanding Inducement in ICT Trading: Applying ICT Concepts

When a key liquidity level breaks and the trend shifts, then you’ll often notice what appears as a “gap” on your trading charts. ICT traders call this a Fair Value Gap (FVG). Specifically, it typically shows up as three consecutive candles. The middle candle is usually longer, and importantly, there are gaps between its wicks and the wicks of the candles on either side. Because of this, these Fair Value Gaps have a tendency to be filled in later. Consequently, ICT traders frequently use this idea when planning their trades.

Understanding Balanced Price Range in ICT Trading

A Balanced Price Range (BPR) in ICT trading happens when you have two opposite Displacements close together, creating two Fair Value Gaps. When the price is in a BPR, it often moves back and forth, testing the highs and lows as it tries to fill both Fair Value Gaps. ICT traders try to trade within this up-and-down movement and also believe that once the price breaks out of the BPR, it’s likely to continue with the original trend.

ttp - a prop firm for stock traders

Summary and Takeaways of ICT Concepts

The financial markets often confuse traders. They are constantly looking for a clear and logical approach. ICT, or Inner Circle Trader, was created by Michael Huddleston. It’s a comprehensive trading program. This program helps traders understand the market. It does so by examining the actions of large institutions, also known as “Smart Money.” Instead of relying solely on typical indicators, ICT emphasizes price action itself. It also focuses on market structure and a crucial concept: liquidity. Liquidity refers to the abundance of buy and sell orders.

The core concept is that large institutions often make slight market manipulations. They do this to fill the buy and sell orders required for their substantial trades. Consequently, ICT aims to teach traders how to spot these maneuvers. It also focuses on how to trade alongside the “Smart Money.” This learning process includes understanding concepts like order blocks and fair value gaps. Furthermore, it involves using Optimal Trade Entry (OTE). OTE helps in identifying good entry points for trades.

ICT doesn’t primarily focus on indicators. However, it does provide specific methods for using standard tools like the RSI. This allows you to double-check your observations. A key element of ICT is analyzing the market across multiple time frames. This process begins with the broader view. Then, traders zoom in to pinpoint the best entry point for a trade. ICT intends to give traders an “insider’s” perspective. This helps them move beyond typical retail trading strategies. By understanding the forces that drive the market, they can discover more consistent ways to make profitable trades.

Trading Calculators

Risk Plan Calculator

What do we need trading calculators for?

Well, let’s just say that today, we are going to talk about risk management from a different point of view.

In most cases, when it comes to risk management, you will think about the amount of money you are willing to risk per trade, for example, or the percentage. Some traders will talk about where to put their stop-loss and the take-profit, some will talk about the risk-reward ratio, and some will talk about scaling into a position.

Our focus today is building a trading plan for the full month and understanding what parameters we need to have to reach a certain amount of P&L at the end of the month. For that, we have developed a series of trading calculators that I will share with you and show you how to use them.

You can use these trading calculators right here, on our website, or easily embed them to your website or blog.


Trading Risk calculator

The first thing I need to do is choose what type of calculation I want to use because when I’m building a risk plan for the full month I need to understand how many trades I need to make, the risk reward ratio, the success rate, how much I’m losing or willing to lose per trade, what are the fees for that account as well and what’s the total P&L that I’m looking to get. Those parameters need to be aligned in order to get me the outcome that I’m looking for.

In order to understand the $ risk you need to take per trade for the whole month, I’ll choose “Risk” from the drop-down list or use the specific “Risk calculator” (right here, below) and add the parameters that I can expect this month. If you’ve been trading for a while now, you should probably have the numbers to work with.

For Example 1:

You might know the percentage of your success, the risk-reward ratio, and how many trades you usually take on an average month. In that case, you already have the numbers. If you don’t have them and you just started to trade, you can put some random numbers or numbers that make sense to you and then try to adjust them along the way.

For Example 2:

If I’m placing 50 trades a month, my win rate is 60%, the risk-reward ratio is 1.5, fees are $300, and I want the outcome, the bottom line of the month, to be $1,000. In that case, I will need to risk $52 per trade.

risk calculator

If I change those parameters, the outcome will be different.

Let’s say these are the average parameters that I have now. As the month progresses, I need to see where the parameters are according to what I actually have produced. If we are closer to the end of the month and I only took 30 trades but still want to reach that P&L, I either need to make more trades or I can increase the risk to ~$86 because I know that at the end of the month, I will reach 40 trades (instead of 50).

Another possibility is if I find that my win rate is 52% (instead of 60%), what I need to do is either focus really hard on finding those A+ setups and wait for that moment to click the mouse on the specific setup that will get me to that 60% success rate or to stick to the 52% but then I need to increase my risk from 52% to 108%.

This trading calculator will guide you along the progress of the month in order to stay within those right parameters to get the right outcome that you’re looking for.

You can adjust your numbers along the way, but at least try to stick with the pre-plan parameters that you had so that you can see the results of what you’re looking for.

P&L Calculator

You can use the P&L calculator if you are interested in calculating, well, your P&L.

Enter the sum you are willing to risk per trade, the number of trades you will be taking this month, your success rate (try to be as accurate as possible; this is not the place to be pretentious!), and your fees in $. After filling out all these parameters, the P&L calculator will calculate the final P&L for that month.

p&l calculator

Like the risk calculator, you can also play with the P&L calculator along the way as the month progresses. If you started with those parameters and you are getting closer to the end of the month and you had fewer trades than expected, you can expect that if you take more trades, you will get roughly the same results at the end of the month.

ttp - a prop firm for stock traders

Risk Reward Ratio Calculator


To calculate the RRR you need, enter your Risk, # of trades, win rate %, fees, and P&L, and you will get the right ratio you need in order to see the outcome of the P&L.

If I’m risking $100, making 50 trades with a 60% success rate, with a $300 fee and $2000 P&L, then I need to create a scenario where I’m ending with a 1.43 on the Risk Reward Ratio. In the case that you see that you are below your RRR that you need, or you see that your success rate is lower, you can adjust it or focus on what you need to do in order to reach that 60% success rate, for example.

Risk reward ratio calculator


Trades Calculator

You can use the trades calculator in order to understand how many trades you need each month to reach the outcome that you want.

In the scenario where I’m risking $100, with a win rate of 60%, the RRR is 2, my fees are $500, and the P&L that I want to achieve is $3000, The number of trades I need to trade along the month is roughly 44 trades. That would give me the outcome of the 3000$.

Again, you can always play with it along the way and modify it according to the real parameters that you see for the specific month that you’re trading; sometimes you will be right on the spot, sometimes it will be higher – and that would be great, and sometimes, of course, you will fall below the numbers, and you need to adjust them in order to understand what you need to do, how much you need to risk from now, or how you can increase your success rate right now, or focusing on risk-reward for example, so you need to take those trades that give you enough space, maybe get smaller stop-losses and increase the profit target and play with it along the way.

number of trades trading calculator

Win Calculator

As the name suggests, this trading calculator will easily calculate the win-rate you will need to have according to the risk, number of trades, RRR, fees, and your target P&L.
win rate calculator

Use the Trading Calculators on your Blog!

We think these calculators are an extremely powerful tool every trader can use, so we made them easy for you to copy and embed them in your blog / course / wherever! Just click on the button and you will get this cool options window that allows you to choose between light-mode and dark-mode and even choose the color that matches your theme!
trading calculator embedding code

Trading Calculators Conclusion

Once you have the risk plan it will be much easier for you to execute it according to what you prepared, so that is very important.

Try to play with it at first. If you already have a few numbers, put the numbers in, or if you’re new to trading, just put random numbers, start with them, and continue to increase or modify them along the way.

If you have any questions about the calculators or if you have ideas for more tools we can develop, let us know in the YouTube video comments.

I hope this trading calculator will be as beneficial to your trading as it is to mine!

Fair Value Gap Trading – Here’s what you need to know

Introduction

While the concept of Fair Value Gap (or FVG) is usually associated with long-term investors, it also plays a vital role in short-term trading too. So much so that there are many traders specialized in trading FVGs and little else.

In today’s article, we’ll learn what a Fair Value Gap is, how to identify one, and how to trade it.

Let’s dive in!

What is a Fair Value Gap?

Just as the name suggests, Fair Value Gap trading involves identifying price gaps that occur when the market reacts to temporary changes in a stock’s fundamentals, such as news releases or large buy/sell orders.
These gaps often represent areas where price has moved too quickly, and it may need to retrace to “fill” these gaps, returning to what was previously perceived as the “right” fair value.

In simple terms, an FVG exists when there is a divergence between the current price and the price and the perceived intrinsic value. This gap creates an opportunity for traders to enter or exit positions based on the expectation that the price will move back toward its fair value. And that’s pretty much what FVG trading is all about.

large bullish FVG - fair value gap

On January 19, 2021, Netflix reported its fourth-quarter earnings. The results showed a massive increase in subscriber growth causing price to gap up massively by the next day’s open.

On January 20, 2021, Netflix’s stock opened at around $565 after closing at around $500 the previous day. The extreme gap presented an opportunity for traders watching for a potential retracement or those looking to short the stock at the top of the gap.

During the following few days, a combination of underwhelming actual profit and investors’ concerns over future growth rates have pushed price back down till the FVG was fully filled.

How do traders identify Fair Value Gaps?

To spot FVGs, traders need to make use of their technical analysis skills and a pinch of understanding of trading psychology.

If you think you have both, here are a few tips you might find useful:

Look for Gaps in Price Action

The simplest method of identifying an FVG is by looking for one on a trading chart. Significant price movements (especially those following news or earnings reports), can create gaps. On a chart, they often appear as a noticeable jump in price between a candle’s close and the next candle’s open price without any trading occurring in between.

Analyze Market Sentiment

As we said earlier, a fair value gap is created when price diverges from the perceived intrinsic value. Since both “current price” and “perceived intrinsic value” are directly linked to market sentiment, this is usually well worth analyzing too.

Tools such as Sentiment Analysis Indicators or the Social Sentiment Index can help you identify prevailing moods in the market.

Check Volume

While high trading volumes during price gaps can indicate strong interest and somewhat confirm the likelihood of the gap being filled, low volume, on the other hand, may suggest that the price movement may not be strong enough to fill the gap completely (or even partially).

Check for Previous Support and Resistance Levels

Historical support and resistance levels can provide insight into ideal levels where price might return to fill the gap.

ttp - a prop firm for stock traders

How to Trade Fair Value Gaps

Now that you know how to identify a Fair Value Gap, the next step is learning how to trade it.

This is what most traders usually do after spotting an FVG and what you can do too to start right now:

Set entry and exit levels

Once you identify a gap, determine the entry point at or near the gap’s optimal price level (the market’s perception of the stock’s intrinsic value). Set your stop-loss orders below the gap for bullish trades and above it for bearish trades.

Follow the market trend

Align your trades with the broader market trend. If the overall market is bullish, go for long positions when entering through FVGs, and vice versa for bearish trends. Following the overall market trend increases the chances of successful trades.

Consider the Fair Value Gap across different time frames

Analyze FVGs across various time frames keeping in mind that gaps in shorter time frames are usually more numerous and can provide more and different opportunities.  Higher time frames, on the other hand, often have more significant implications and dramatic retracements.

Monitor Market News:
Be aware and keep an eye on upcoming news events or economic data that might impact the asset’s price. These events can sometimes cause sudden volatility and potentially affect your FVG trading strategy.

Backtest Strategies:
As for all other trading strategies, do use your diligence, and use historical data to backtest your FVG trading strategy before implementing it. Check results to evaluate performance and make the necessary adjustments.

fair value gap - large bearish fvg

Following news of an antitrust investigation launched by the Chinese Government on Alibaba (BABA), the stock price dropped from around $255 at the 23rd December 2020 market close to just above $211 at the opening of the following day thus creating an FVG of over 17%.

Once again, positive sentiment toward the stock and strong sales figures pushed price back up to fair value and made FVG traders exceedingly good profit in just a few days.

Conclusion

Fair Value Gap trading offers a unique perspective on price movements and market inefficiencies, and it allows FVG traders to step into positions that match their expected price corrections.

Once you fully understand how to identify, analyze, and trade FVGs, you’ll have added another great tool to your trading arsenal. It’s only forward and upward from there!

Hope this helps!


What Is Stock Lending?

Introduction

Today, we’ll look at stock lending, one of the ways stock traders and investors profit from idle stock they own in their portfolio and from stock they are able to borrow from one another.
In this article, we’ll explore the lending exchange’s dynamics and components as well as its advantages and fees.

What is stock lending?

At its core, stock lending is exactly what it sounds like. It’s a transaction where one party – facilitated by a broker – lends shares of a stock to another party for a fee.
“And who would want to pay a fee just to temporarily hold someone else’s stock?” I hear you ask.

Well, usually, short sellers do.

Short sellers sell the stock they borrow with the expectation that it can be repurchased at a lower price in the future.
In this context, stock lending allows traders to gain access to and “use” shares they do not own and, by doing so, facilitates the short-selling process.

Key Notes
The three parties that participate in each lending agreement:

  • The Lender: Normally an institution or a trader/investor with a margin account.
  • The Borrower: Usually a short seller.
  • The Broker: It facilitates the exchange.

What are the components of stock lending?

The components of stock lending can be broken down into a few key groups:

The Lender and the Borrower:

The lender is usually an institutional investor or a margin account holder with the ability to lend their shares.
The borrower is often a short seller or any trader who needs stock at his disposal in order to execute a particular strategy.

The Broker

Brokers play a crucial role as intermediaries in the stock lending process. They facilitate transactions, help identify potential lending parties, and ensure that all relevant regulations are upheld.

Collateral

As for most types of loans, some sort of collateral is usually required from the borrower. This can be in the form of cash, stock, or other securities, and the required amount is normally greater than the value of the stock being borrowed.
The presence of collateral helps reassure the lenders and makes them more prone to keep lending in the future since they have some assurance that they will be compensated in case the borrower defaults.

Fee Structure

As you might have guessed, the lender charges a fee to the borrower, and the value of that fee is determined by the stock’s demand in the lending market. While fees increase with higher demand, you can expect to see them falling when demand diminishes.

Market Liquidity

One of the key benefits of stock lending is the added liquidity it brings to the market. When shares are made available for lending, it facilitates trading strategies that might otherwise not be possible, and this, of course, makes the market more efficient.

Why lend and borrow stock in the first place?

The simple answer is “because it can make money!”
After all, isn’t the highest possible return on investment every trader’s and investor’s objective?

It’s easy to see how stock lending can offer profitable opportunities to both lenders and borrowers alike.
Borrowers (such as institutional investors or individuals who hold stocks in margin accounts)  and, by lending out shares they hold, lenders can earn fees without parting with their underlying investments. This is perfect for long-term investors who believe in the fundamentals of their investments but still want to capitalize on short-term lending opportunities.

Stock lending rates

The rates associated with stock lending can vary significantly based on a multitude of factors. Here’s a closer look at what influences these rates and what traders should keep in mind.

Factors that influence stock lending rates

Supply and Demand
As with any market, stock lending rates largely depend on supply and demand.
When there are more borrowers than available shares, borrowing costs can soar. In contrast, if there are many shares available and fewer borrowers, rates tend to be lower.

Stock Characteristics
Some stocks are more popular or volatile than others and this also influences the corresponding lending rates. For example, stocks of companies that are frequently subject to short selling (like tech firms or those subjected to news-driven price fluctuations) might demand higher rates.

Market Conditions
Overall market sentiment plays a significant role in stock lending rates.
During bearish markets, the demand for borrowing may increase as traders look to short overvalued stocks, resulting in higher lending fees. Conversely, in bullish markets, those rates might decline as fewer traders seek to short stocks.

Duration of Loan
Rates may also fluctuate based on the loan duration.
Shorter-term loans may have a different fee structure than longer-term ones, reflecting the different risks.

ttp - a prop firm for stock traders

Risks and considerations

While stock lending can be profitable, it also comes with risks so be always aware of these::

Counterparty Risk

When lending stock, the main concern for the lender is that the borrower might become unable to pay back their debt and default on their obligation
Make sure you keep yourself informed of your broker’s terms and conditions concerning stock lending and collateral.

Stock market volatility

The value of the lent securities can fluctuate during the borrowing period. Keep in mind that this might influence not just the borrower’s strategy but also the lender’s equity position.

Law and regulations

The securities lending market is subject to various regulations that can affect both lenders and borrowers. Staying informed about these regulations is essential for minimizing legal risks associated with stock lending.

Conclusion

With that said, we suggest you continue your research on stock lending to take advantage of all the benefits that it can offer before throwing yourself all in and – talking of “benefits” – if you don’t have a margin trading account yet, take a look at the Trade The Pool website now.
You’ll thank me later.


Hope this helps.

Merry Xmass. Happy New 2024 Year