Understanding the ICT market structure shift is the next crucial step for any trader using Inner Circle Trader concepts effectively. This market structure isn’t just another tool; it’s the fundamental groundwork for making high-probability trading decisions. So, what exactly is ICT market structure shift? In simple terms, it’s a powerful way to analyze the market’s overall direction and behavior. By breaking down its different components, traders gain profound insights into key phases. These include situations in which large institutions might manipulate prices, accumulate positions, or initiate major moves. Additionally, understanding ICT market structure helps you spot and react to crucial shifts in market trends, ultimately leading to smarter, more confident trades.
Key Notes
-
- Introduction to Market Structure Shift
- Liquidity Pools
- Break of Structure (BOS)
- Change of Character
- Order Blocks
- Fair Value Gaps (FVG)
- Balanced Price Range (BPR)
- Relative Strength Index (RSI)
- Power of Three (PO3)
Introducing Market Structure Shift: Core ICT Principles
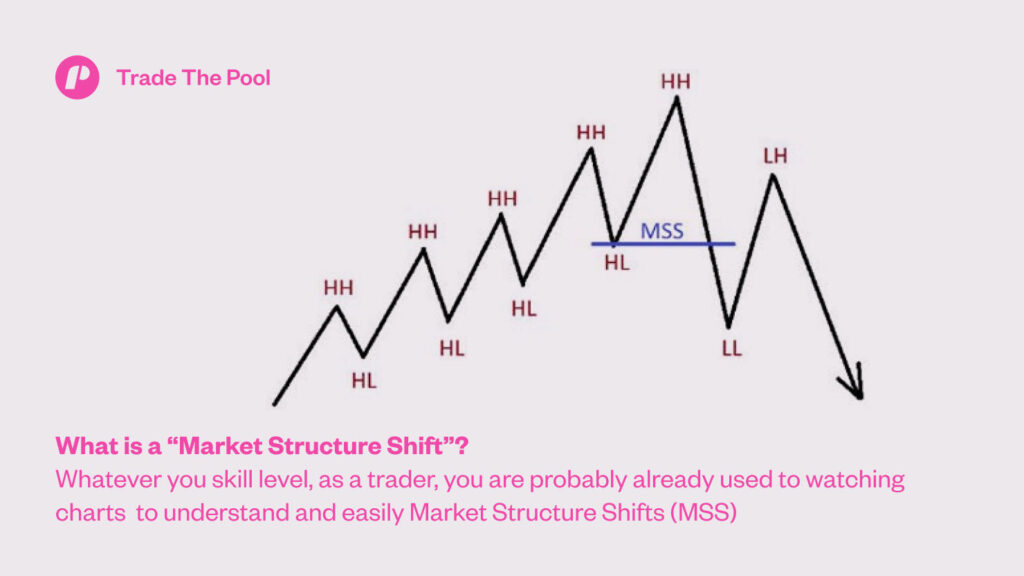
The ICT market structure helps identify the market’s likely direction by analyzing essential swing highs and swing lows. The power lies in understanding why these levels matter, particularly about ‘smart money’ (large institutions) activity. Their significant moves often create these structural points. A critical idea is the ‘Market Structure Shift’ (usually a Break of Structure, or BOS), which indicates trend continuation. Conversely, ICT traders also watch for a ‘Change of Character’ (ChoCH), an early sign of a potential trend reversal. Analyzing ICT market structure goes beyond simple patterns; it deciphers the underlying buying and selling dynamics driven by big players at these crucial levels.
What are ICT Liquidity Pools?
As we delve deeper into ‘smart money’ operations within market structure, liquidity pools emerge as a key concept. What are ICT liquidity pools? Think of these as concentrations of resting orders on a price chart, including stop-loss, take-profit, and pending limit orders. Large institutions require significant opposing orders to execute their vast trades without causing substantial price swings. Liquidity pools provide precisely that. These big players often target areas with many clustered orders, typically just above recent swing highs (this is Buy-Side Liquidity – BSL). They also look below recent swing lows (Sell-Side Liquidity – SSL). Knowing where these pools likely sit gives ICT traders a real edge when anticipating future price movements.
What is ICT Break of Structure (BOS)?
After learning how ‘smart money’ targets liquidity pools, the Break of Structure (BOS) emerges as a crucial ICT market structure concept. What is ICT break of structure (BOS)? Essentially, price action traders, including those following SMC and ICT, use a BOS to confirm that the current market trend will likely continue. To understand this, picture an uptrend where the market consistently forms higher highs and higher lows. A BOS happens when the price decisively breaks and closes above the most recent high. It’s a clear market signal: ‘The upward move is still on!’ For ICT traders, spotting a BOS strongly indicates buying opportunities. Likewise, in a downtrend, a BOS occurs when the price breaks below the most recent low, suggesting continued downward momentum.
Validating Market Structure Shifts
For a valid Market Structure Shift (BOS), the price must break past a swing high or low with a full-bodied candle, not just a wick. A wick-only breach suggests a simple Liquidity Grab, which often results in a brief pullback, not a genuine trend reversal. ‘Smart money’ creates these grabs to target concentrated stop-loss levels. Understanding this distinction helps ICT traders confirm actual trend changes versus temporary manipulations, avoiding false signals.
What is ICT Change of Character (ChoCH)?
While a Break of Structure (BOS) suggests trend continuation, sometimes momentum slows, hinting at a reversal. Such instances introduce another critical ICT concept: the Change of Character, or ChoCH (pronounced “chotch”). What is ICT change of character (ChoCH)? Imagine a clear uptrend forming higher highs and lower lows. A ChoCH occurs when the price unexpectedly drops and closes below a recent swing low. Such a drop signals that buyers might lose control, and sellers could step in. Conversely, in a downtrend characterized by lower highs and lower lows, a ChoCH occurs when the price suddenly jumps and breaks above a recent swing high. This sudden jump suggests sellers are weakening, and a bullish reversal may be on the horizon. Remember, a ChoCH is only an early signal, not a guaranteed reversal, but it alerts ICT traders to a weakening dominant trend.
What are ICT Order Blocks?
Building on our understanding of potential trend shifts, Order Blocks are specific areas on the chart that ICT traders closely observe. What are ICT order blocks? Imagine ‘smart money’ leaving a footprint just before a significant price move. An order block is typically the last candle moving in the opposite direction right before an important, fast price increase or decrease. For example, a strong upward move might follow the previous downward candle, which acts as an order block. ICT traders believe large institutions place their significant orders at these spots. Because of this, price often revisits these levels later. When price returns to an order block formed before an upward move, it frequently acts like support.
Conversely, in a dropping market, the last upward candle before a significant fall could be an order block, potentially acting as resistance if the price attempts to return there. So, order blocks function as critical zones where large institutional orders might remain unfilled, making them potential areas for market direction changes.

What are ICT Fair Value Gaps (FVG)?
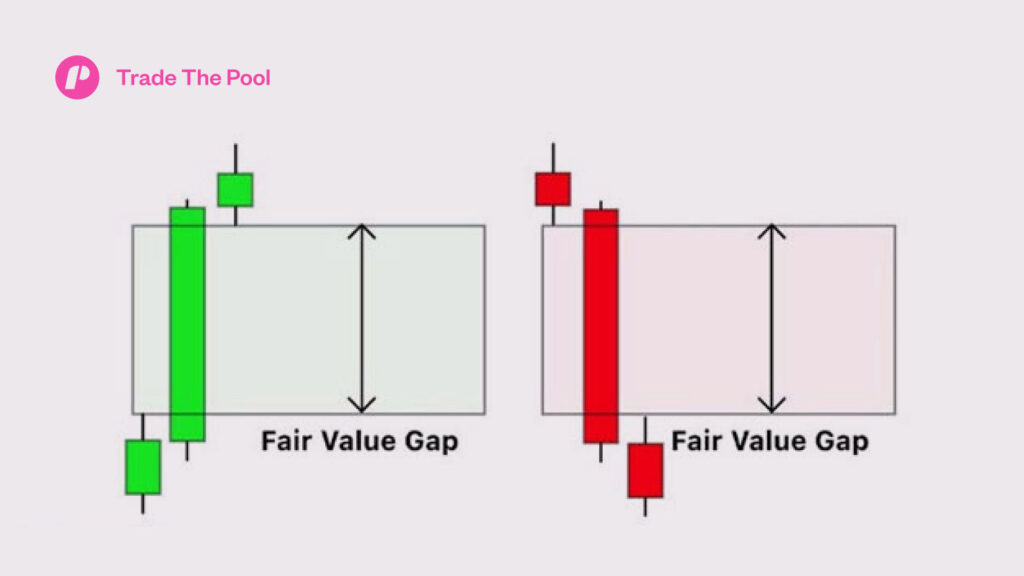
After examining Order Blocks as potential ‘smart money’ entry points, Fair Value Gaps (FVG) present another intriguing phenomenon that ICT traders observe. What are ICT fair value gaps (FVG)? An FVG is essentially a market inefficiency where price moves so quickly and impulsively, leaving behind an area with minimal trading. You often see this as a three-candle pattern. Here, the middle candle’s body does not overlap with the bodies or even the wicks of the candles immediately before and after it. ICT traders believe these gaps form due to aggressive institutional moves. They anticipate the market will eventually return to “fill” these gaps, meaning the price will trade within that previously void area. Filling these gaps ensures a more ‘fair’ distribution of trading activity across the entire range.
What are the ICT Premium and Discount arrays?
When ICT traders seek optimal buying or selling spots, they often use premium and discount arrays. What are ICT premium and discount arrays? Visualize the price range between a significant swing low and swing high. ICT divides this range at the 50% mark. The area above 50% is the premium zone. Here, traders typically look for selling opportunities. Think of it like items sold at a higher price. Below 50% lies the discount zone. In the discount zone, they seek buying opportunities. Consider it like acquiring items on sale. These zones combine with market structure understanding to pinpoint high-probability trading setups.
What is ICT Balanced Price Range (BPR)?
Have you observed price chopping in a tight range for a while? That might be what ICT traders call a Balanced Price Range (BPR). What is ICT balanced price range (BPR)? It occurs when two strong, opposing price moves happen close together, creating two overlapping Fair Value Gaps. Such overlapping Fair Value Gaps often result in price chopping within a tight range, signaling market indecision and inefficient price action. ICT traders observe BPRs for eventual breakouts in the direction of the identified prevailing trend.
What is ICT Buy-Side Liquidity (BSL)?
Building on the concept of liquidity pools, Buy-Side Liquidity (BSL) refers specifically to buy orders. These orders typically position just above significant swing highs on the price chart. What is ICT buy-side liquidity (BSL)? Traders who anticipate further price increases place buy-stop orders here. Also, traders in short positions set their take-profit orders in these areas. The ‘smart money’ often targets such concentrations of orders. They do this to fill their own large sales orders. The sheer volume of buy orders in these pools allows big players to sell substantial quantities without immediately crashing the price. Understanding these specific liquidity zones gives ICT traders a crucial edge, helping them anticipate potential market movements more accurately.
What is ICT Sell-Side Liquidity (SSL)?
Mirroring BSL, Sell-Side Liquidity (SSL) represents another form of liquidity pool. These pools comprise sell orders typically resting just below significant swing lows on the chart. What is ICT sell-side liquidity (SSL)? Such orders include sell-stop placements from traders expecting further price drops. They also encompass take-profit orders from traders holding long positions. ‘Smart money’ frequently targets these precise areas. They do this to fill their substantial buy orders. The large volume of sell orders found in these pools allows big players to buy in bulk efficiently, without causing an immediate, sharp price surge. Recognizing these specific liquidity targets empowers ICT traders to anticipate market dynamics better.
What is ICT Inducement?
Inducement is a deceptive tactic that ‘smart money’ may employ. What is ICT inducement? It’s a price movement appearing as a genuine breakout or trend continuation, but ‘smart money’ designs it to trick retail traders into entering positions in the wrong direction. Inducement often happens near areas where there’s a lot of liquidity. For instance, a small move above a recent high might entice many retail traders to buy, anticipating a continued upward trend. However, ‘smart money’ may have simply used this move to grab liquidity before reversing price downwards, triggering those new buyers’ stop losses. ICT traders learn to identify these patterns to avoid such traps.
What are ICT Kill Zones?
ICT kill zones are specific periods that ICT traders pay heightened attention to during the trading day. What are ICT kill zones? These times typically mark the most active periods for large institutional players, leading to higher probability trading setups based on market structure shift. Kill zones often precisely align with the opening times of major financial centers globally, like the London Open, the New York Open, and occasionally even around the New York Lunch Hour. Significant impulsive moves frequently occur during these windows, presenting prime opportunities that ICT strategies aim to capitalize on. Recognizing these specific timeframes helps traders focus their analysis and trade entry, leveraging institutional participation for better outcomes.
What are ICT Breaker Blocks?
Building on the concept of order blocks, a breaker block represents a specialized and dynamic type. What are ICT breaker blocks? Picture an order block that first acts as a support level in an uptrend. If the price then breaks down through this level with significant force and conviction, that previously supportive order block transforms. It typically becomes a resistance level upon retest by price. Conversely, in a downtrend, a broken resistance order block can similarly become a support level. ICT traders diligently observe these breaker blocks, as they often pinpoint crucial zones where the market might either reject further movement or find reliable support. Understanding their formation provides predictive power.
Complementary Tool: Relative Strength Index (RSI)
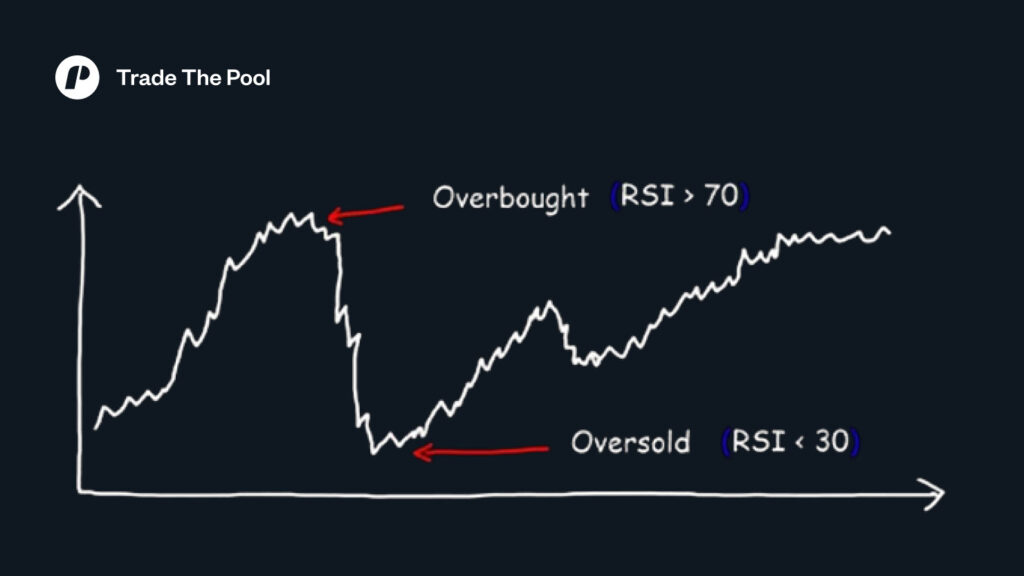
Beyond ICT-specific tools, some traders effectively use traditional technical indicators. The Relative Strength Index (RSI) is a popular choice for confirming Market Structure Shifts. An RSI reading above 70 signals overbought conditions, hinting at potential exhaustion in an uptrend. Conversely, a reading below 30 indicates oversold conditions, suggesting a downtrend may be fatigued. When an MSS coincides with these overbought or oversold RSI readings, it provides a stronger indication of an imminent trend change. Traders can then seek to position themselves on the right side of the market’s new direction.
How to Trade a Market Structure Shift
Trading a Market Structure Shift (MSS) starts with its clear identification and confirmation. For a bullish MSS ending a bearish trend, confirmation occurs when the first higher high closes above the previous lower high. Conversely, for a bearish MSS ending a bullish trend, confirmation happens when the first lower low closes below the previous higher low. Once confirmed, traders seek entry opportunities within the corresponding Fair Value Gap (FVG). They can use Fibonacci levels to set stop-loss and take-profit targets. Manual placement involves setting a stop-loss at the lowest level before a bullish MSS or the highest level before a bearish MSS. Profit targets typically sit near the previous trend’s extreme levels before the shift.
What is the ICT Power of Three (PO3)?
Integrating many ICT market structure concepts, the ICT Power of Three (PO3) functions as a daily model for price action. What is the ICT power of three (PO3)? This model suggests the trading day often follows a three-phase “script”:
- Accumulation: A quiet period where ‘smart money’ builds positions, with minimal price movement.
- Manipulation: Occurring around major trading session opens, this phase involves a price move against the overall trend. ICT traders believe this move aims to trigger retail stop losses and entice misdirected entries (linking to inducement).
- Distribution: This final phase sees the price execute its actual intended move. ‘Smart money’ profits from earlier accumulated positions here.
The Power of Three, therefore, outlines a daily cycle: consolidation, a false liquidity-grab, then the actual intended price action.
Closing Thoughts
The ICT market structure approach provides traders with a powerful lens for understanding market dynamics. It transcends simple chart patterns, delving into the underlying forces of price movement, particularly the influence of ‘smart money.’ Mastering concepts like swing highs and lows, liquidity pools, and Break of Structure (BOS) provides traders with clearer insight into market direction.
Furthermore, identifying early trend shifts with a Change of Character (ChoCH) refines trading precision. Pinpointing strategic entry/exit zones uses Order Blocks and Fair Value Gaps (FVGs). Applying premium/discount arrays further aids traders. Recognizing Balanced Price Ranges (BPRs) also enhances decision-making. So does understanding Buy-Side and Sell-Side Liquidity (BSL/SSL) targets. Being aware of inducement tricks saves traders from getting caught out. Finally, the Power of Three (PO3) model offers a holistic view of daily market cycles. This integrated understanding empowers traders to execute smarter, more confident trades by aligning with the institutional flow. To start trading today, join Trade The Pool now!
If you liked this post make sure to share it!