On Tuesday, October 20, Exxon’s stock price closed at $177.86. This means that its shares have gained almost 49% compared to the beginning of 2026. At the same time, the price of Brent stood just below $110 per barrel.
The majority of the growth is related to the war with Iran and ongoing strikes near the Strait of Hormuz. ExxonMobil is currently trading higher than the consensus estimate from Wall Street.
🔗Hormuz 2026: Markets on Edge as Strait Closure Sparks Volatility
That sets up a sharp question for the third-quarter report on Friday, October 30. Investors know the war lifted Exxon’s earnings.
They need to know how much of the company’s value survives once oil cools. The answer depends on assets far from the Gulf. They include the Permian Basin, offshore Guyana, and a cost base Exxon has spent six years cutting.
How the War Reset the Exxon Stock Price
This all started with strikes at the beginning of 2026, followed by confrontation. In normal times, about 18 million barrels of oil are transported daily through the Strait of Hormuz.
Oxford Economics estimated in March that the second quarter would lose an average of 7.5 million barrels per day. Iran has since stepped up drone attacks on tankers, and Brent closed at $109.86 on October 16.
🔗Volatility & Geopolitics: The Scarcity Age
Equity Valuation & Commodity Benchmarks
| Valuation & Market Performance Metric | Figure / Financial Value |
|---|---|
| Closing Share Price (October 20, 2026) | $177.86 per share |
| Closing Share Price (October 1, 2026) | $163.82 per share |
| Year-to-Date Gain (Through October 16, 2026) | About +49.0% increase |
| Brent Crude Benchmark (October 16, 2026 Close) | $109.86 per barrel |
| Street Consensus Mean Price Target (TIKR) | About $175.00 per share |
| Declared Quarterly Dividend Payout | $1.03 per share |
The October rally added about 9% in under three weeks. Morgan Stanley raised its target to $185 on October 15.
Wells Fargo holds $182 with an Equal Weight rating. Most analysts sit at Hold, which shows caution about chasing a commodity spike.
🔗Analyst Price Targets Explained
In our view, the shares now carry a war premium that the long-term fundamentals do not fully support.
That does not make the stock expensive on current cash flow. It makes it sensitive to any ceasefire headline.
Investment takeaway: At this level, Exxon is already above the average price target of analysts. For the stock to go higher, oil prices would need to rise, or estimates would need to move up.
The Second Quarter Showed the Windfall
The second-quarter results of Exxon show, in numbers, how much the war has affected the company.
GAAP earnings came to $14.5 billion, which is $3.48 per share.
In the first quarter, the same figure was only $4.2 billion. Free cash flow, for its part, rose to $17.2 billion.
Quarterly Financial Performance & Production Metrics
| Financial & Operational Metric | Q2 2026 Results | Q1 2026 Results |
|---|---|---|
| GAAP Net Earnings | $14.5 Billion | $4.2 Billion |
| Earnings Excluding Identified Items | $14.7 Billion | $8.8 Billion |
| Diluted EPS Excluding Identified Items | $3.52 per share | $2.09 per share |
| Cash Flow from Operating Activities | $23.6 Billion | $8.7 Billion |
| Free Cash Flow Generation | $17.2 Billion | $2.7 Billion |
| Hydrocarbon Production (MBOEPD) | 4,514 thousand boe/day | 4,594 thousand boe/day |
🔗How to Read an Earnings Report
There are two points in these results that are worth a closer look. First, production fell slightly, so higher prices drove the earnings surge, not volume.
Second, timing effects added about $2.5 billion to the quarter. Exxon expects such effects to unwind later.
Price, not production, delivered the record quarter, and price is the variable Exxon controls least.
The quarter also carried war costs. Identified items cut earnings by $2.6 billion. They included $1.1 billion of impairments and $1.4 billion of additions to financial reserves.
On top of that, the impact from the Middle East took away another $194 million.
🔗Earnings Per Share (EPS) Explained
Investment Takeaway: The second-quarter earnings came under peak conditions. For this reason, multiplying them by four to value the shares would be misleading.
The Hidden Cost: Qatar’s Damaged LNG Trains
The war also hit Exxon directly. Iranian strikes on Ras Laffan in March damaged two of Qatar’s 14 LNG trains.
QatarEnergy said about 17% of the country’s export capacity would stay offline for three to five years. That equals 12.8 million tons a year.
🔗Best Natural Gas Stocks to Buy in 2026
Damaged Qatari Energy Infrastructure Assets
| Damaged Qatari Asset / Facility | ExxonMobil Equity Stake | Expected Production Outage Duration |
|---|---|---|
| Liquefied Natural Gas (LNG) Train S4 | 34.0% interest | Three to five years |
| Liquefied Natural Gas (LNG) Train S6 | 30.0% interest | Three to five years |
That loss rarely appears in bullish coverage. Higher oil prices more than offset it today. If crude falls, however, Exxon keeps the lost LNG volume without the price windfall.
A ceasefire would remove the upside of the war while leaving part of its damage in place.

Investment Takeaway: Exxon’s war exposure cuts both ways. Model the Qatar outage as a multi-year volume loss, not a temporary one.
What Survives After the Spike: Permian and Guyana
Over the long term, the case for Exxon depends mainly on two growth assets with low production costs. Both would keep producing cash at far lower oil prices.
The Permian Basin set another record in the second quarter. Production went above 1.8 million barrels of oil equivalent per day.
Exxon reached this size thanks to its $60 billion acquisition of Pioneer. In addition, long horizontal wells and connected blocks of land help keep development costs down.
🔗How Mergers and Acquisitions Move Stocks
Guyana provides the second engine. Exxon is the operator of the Stabroek Block, where it owns 45%.
Chevron, which has since acquired Hess, owns 30%, while CNOOC holds the other 25%. In 2025, gross production from the block was above 700,000 barrels a day.
The fifth production vessel is already on its way, and Exxon expects it to begin operating in the fourth quarter. Once running, it will add 250,000 barrels a day of capacity.
Upstream Growth Engines & Operational Expansion
| Strategic Growth Engine | Recent Operational Status & Throughput | Next Production Milestone & Expansion Catalyst |
|---|---|---|
| Permian Basin Unconventional Assets | Record 1.8M+ boe/d achieved in Q2 2026 | Accelerated drilling and synergy extraction from acquired Pioneer acreage |
| Guyana Stabroek Offshore Block | Over 700,000 b/d gross production reached in 2025 | Fifth floating production storage and offloading (FPSO) vessel online in Q4 2026 |
Because of these assets, Exxon is in a position to grow volumes even if Brent returns to pre-war levels. They do not, however, justify war-level earnings on their own.
Investment Takeaway: In the fourth quarter, the most important operational event is the start of the fifth vessel in Guyana. If it starts up without problems, volumes would likely hold up well into 2027.
The Financial Base Before the War
To see how much Exxon can earn at normal prices, the 2025 results are a good reference.
With weaker crude prices, earnings dropped from $33.7 billion to $28.8 billion.
Even so, free cash flow came to $26.1 billion, which was more than enough to pay $17.2 billion in dividends.
Full-Year Financial Performance & Capital Allocation Metrics
| Financial & Capital Allocation Metric | FY2024 Results | FY2025 Results |
|---|---|---|
| GAAP Net Earnings | $33.7 Billion | $28.8 Billion |
| Adjusted Diluted EPS (Excluding Identified Items) | $7.79 per share | $6.99 per share |
| Cash Flow from Operating Activities | $55.0 Billion | $52.0 Billion |
| Free Cash Flow Generation | $34.4 Billion | $26.1 Billion |
| Cash Capital Expenditures (CapEx) | $25.6 Billion | $29.0 Billion |
| Share Repurchases & Buybacks | $19.6 Billion | $20.0 Billion |
The balance sheet stays conservative. At the end of 2025, Exxon’s net-debt-to-capital ratio stood at 11%.
Since 2019, the company says it has saved $15.1 billion in structural costs, $3 billion of which came in 2025.
For 2026, Exxon plans $20 billion in buybacks and capital spending of $27 billion to $29 billion.
Even in a year of weaker oil prices, Exxon paid its dividend out of free cash flow. This track record becomes most relevant if prices drop sharply.
🔗Dividend Stocks Explained
Investment Takeaway: The dividend looks secure at normal oil prices. The $20 billion buyback is the more flexible line if crude falls.
Capital Returns: Where the Buyback Money Comes From
A look at the 2025 numbers shows a gap that is easy to miss. Exxon returned $37.2 billion to shareholders, while its free cash flow was $26.1 billion.
The difference of about $11 billion came from the balance sheet, by our calculation.
FY2025 Capital Returns & Shareholder Distribution Math
| Capital Return & Cash Flow Metric (FY2025) | Financial Amount / Balance Impact |
|---|---|
| Free Cash Flow Generation | $26.1 Billion |
| Total Dividends Paid to Shareholders | $17.2 Billion |
| Share Repurchases & Buybacks Executed | $20.0 Billion |
| Total Shareholder Distributions | $37.2 Billion |
| Distribution Gap Funded by Balance Sheet / Cash Reserves | About $11.0 Billion deficit |
🔗Stock Buybacks Explained
The war changed that equation. The combined total of the free cash flows for the first six months of 2026 is $19.9 billion.
This is close to the total free cash flow of 2025. At current oil prices, the company can pay dividends and repurchase stocks without needing any borrowings.
At pre-war prices, the buyback will rely on a balance sheet which has some, but not unlimited, flexibility.
Investment Takeaway: Watch the buyback commentary on October 30. A raised pace would signal confidence in cash flow beyond the war. A held pace would signal caution.
Valuing the Exxon Stock Price on Two Kinds of Earnings
The valuation looks very different depending on which earnings an investor trusts. The table below compares the share price with two earnings bases, by our calculation.
Valuation Lens Analysis ($177.86 Share Price)
| Valuation Lens / Earnings Scenario | Earnings Per Share (EPS) Basis | Implied Valuation Multiple / Yield |
|---|---|---|
| Pre-War Baseline (FY2025 Adjusted EPS) | $6.99 per share | About 25.0x P/E multiple |
| War Run-Rate (H1 2026 Adjusted EPS, Annualized) | $11.20 per share (annualized) | About 16.0x P/E multiple |
| Income Return (Annualized Dividend Payout) | $4.12 annualized ($1.03/quarter) | About 2.3% dividend yield |
On a war-level earnings basis, Exxon looks reasonably priced. In a normal year, it looks expensive for a mature producer.
The XOM stock price sits between those two worlds, and the gap closes only as oil settles. The annualized figure is illustrative, since one strong quarter does not make a run rate.
🔗Cyclical Stocks in 2026: The Complete Prop Trader’s Guide
Investment Takeaway: Buying the stock at these levels means, in practice, betting that 2027 earnings will remain well above those of 2025. Permian and Guyana growth help, but cannot carry that alone.
The Texas Move and Governance
Exxon changed its legal home this year. On July 1, a new Texas parent, ExxonMobil Holdings Corporation, replaced the New Jersey company. The shareholders had already approved this change on May 27.
Holders received one new share for each old share, and the stock is still traded under the XOM symbol.
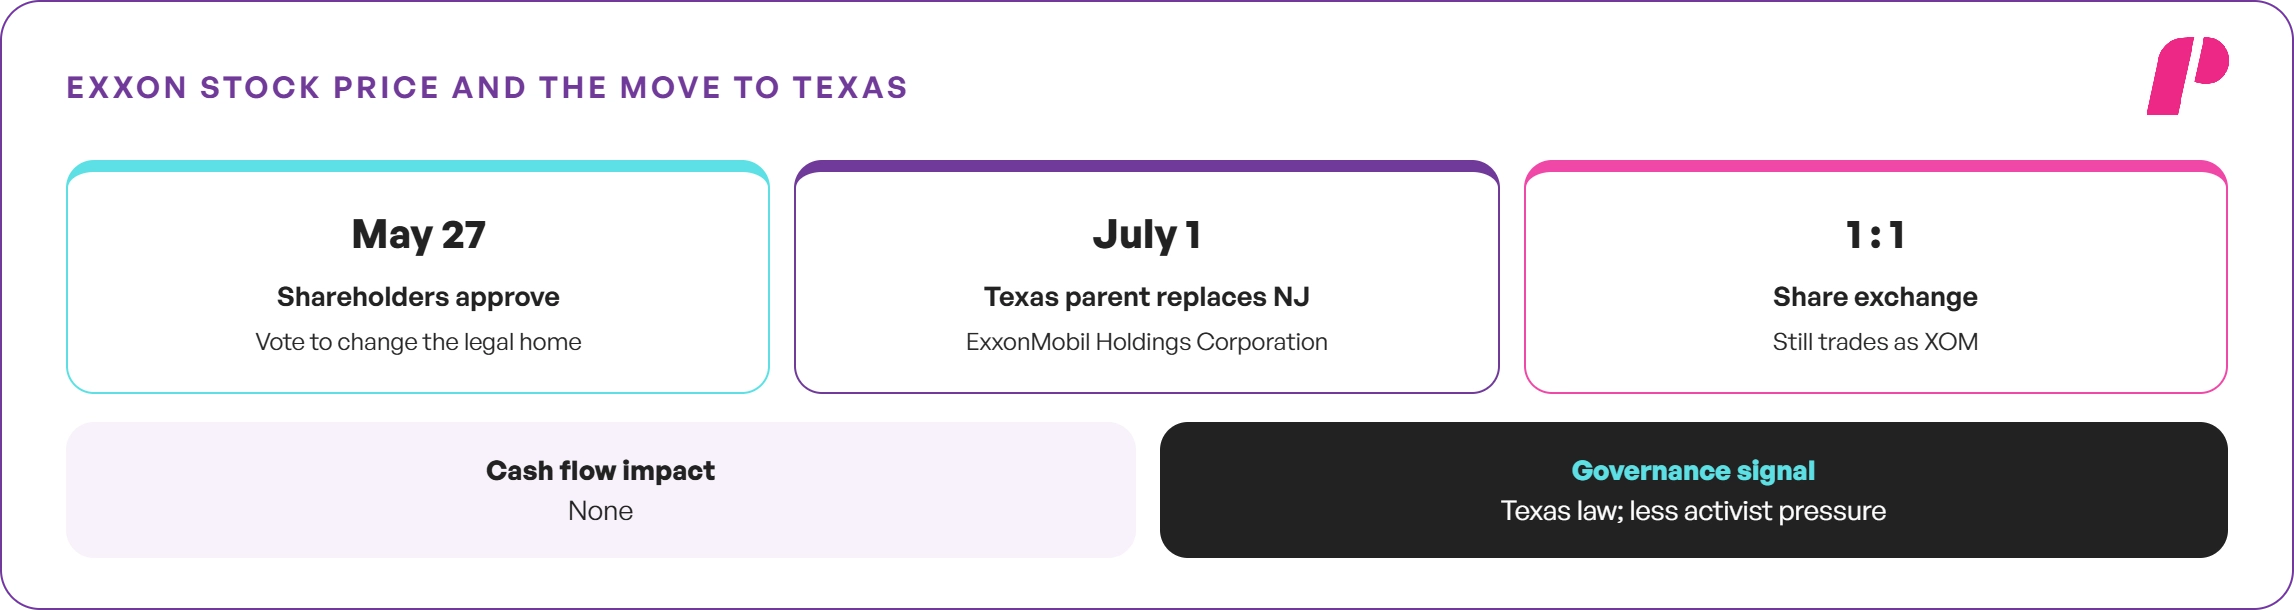
Texas law now applies to the rights of the shareholders. Management argues the state’s new business courts offer a more predictable venue.
From a trader’s point of view, the change does not affect cash flow. However, it suggests the board wants to limit pressure from activist investors.
Reading the Q3 Earnings Considerations
Exxon publishes an “earnings considerations” filing before each report. It lists how market factors changed versus the prior quarter.
Exxon makes a point of saying that these numbers should not be read as an earnings estimate.
Earnings Variance & Price Realization Factors
| Earnings Variance Factor (Q3 2026 vs. Q2 2026) | Estimated Financial Impact |
|---|---|
| Liquids Price Realizations | $(1.3) Billion negative impact |
| Natural Gas Price Realizations | +$0.3 Billion positive impact |
| Energy Products Margins | +$4.5 Billion positive impact |
| Chemical Products Margins | $(0.6) Billion negative impact |
| Specialty Products Margins | +$0.5 Billion positive impact |
| Timing Effects (Excluded From Adjusted Earnings) | $(2.5) Billion non-operating impact |
The message is clear. Refining margins, not crude, drove the third quarter. Based on the filing, margins from Energy Products generate around $4.5 billion, while lower liquids realizations subtract $1.3 billion.
As Exxon is an integrated firm, the additional gain was shifted from oil production to refining.
It is important to understand how the process works. Whenever Gulf production is affected, there is less crude and refined product in the market, especially diesel and jet fuel.
Product prices can then rise faster than crude, which widens refining margins. Exxon runs one of the world’s largest refining systems, so it captures that spread directly.
🔗Refining Margins and Crack Spreads Explained
In our view, that refining leverage makes Exxon a broader war beneficiary than a pure crude producer.
The timing line requires care. Timing effects come from differences in how derivatives and inventories are valued, and Exxon leaves them out of adjusted earnings.
As a result, a negative $2.5 billion figure can pull GAAP results down sharply, even with a healthy core business.
Investment Takeaway: The more useful number to follow is earnings excluding identified items and timing effects. GAAP headlines may understate the quarter’s underlying strength.
Trading the October 30 Report
Exxon will publish its results at around 5:30 a.m. Central Time, which is before the market opens. To prepare for the event, traders can use a basic expected-move calculation.

🔗Options Expected Move Explained
The example below assumes a hypothetical implied move of 3%. Traders should replace it with live options data before the report.
$177.86 × 0.03 ≈ $5.34, implying a range of roughly $172.52 to $183.20
Earnings Scenario Planning & Price Action Triggers
| Market Scenario | Catalyst Trigger & Operational Event | Possible Price Reaction & Technical Result |
|---|---|---|
| Bullish Scenario | Robust refining margin earnings and increased share buyback authorizations | Upside breakout above current trading range |
| Base Case Scenario | Financial results and operational outputs match Wall Street consensus expectations | Sideways consolidation within established range |
| Bearish Scenario | Geopolitical ceasefire headlines, asset impairment charges, or reserve adjustments | Downside breakdown below support range |
Position size should follow risk. A $100,000 account risking 1% has a $1,000 budget. With a stop one expected move away, size equals $1,000 ÷ $5.34, or about 187 shares. These figures are illustrative only.
🔗Position Sizing in Forex & Stocks
Investment Takeaway: Geopolitical headlines can move XOM more than the report itself. Oil news in the days before Friday’s release could reset the range.
The Risks That Matter for the XOM Stock Price
- Ceasefire risk. A durable ceasefire could pull Brent down quickly and compress the premium.
- Qatar outage. Two LNG trains with Exxon stakes stay offline for three to five years.
- Timing reversals. Large timing effects can swing reported earnings.
- Chemical margins. Chemical Products margins weakened again in the third quarter.
- Valuation. The XOM stock price trades above the Street mean target.
- Guyana execution. Any delay at the fifth FPSO would slow volume growth.
🔗Risk Management in Stocks: A Complete Guide 2026
Closing Thoughts
ExxonMobil has turned a geopolitical shock into record cash flow. Its integrated model moved profits from crude to refining as conditions shifted. Its balance sheet remains among the strongest in the industry.
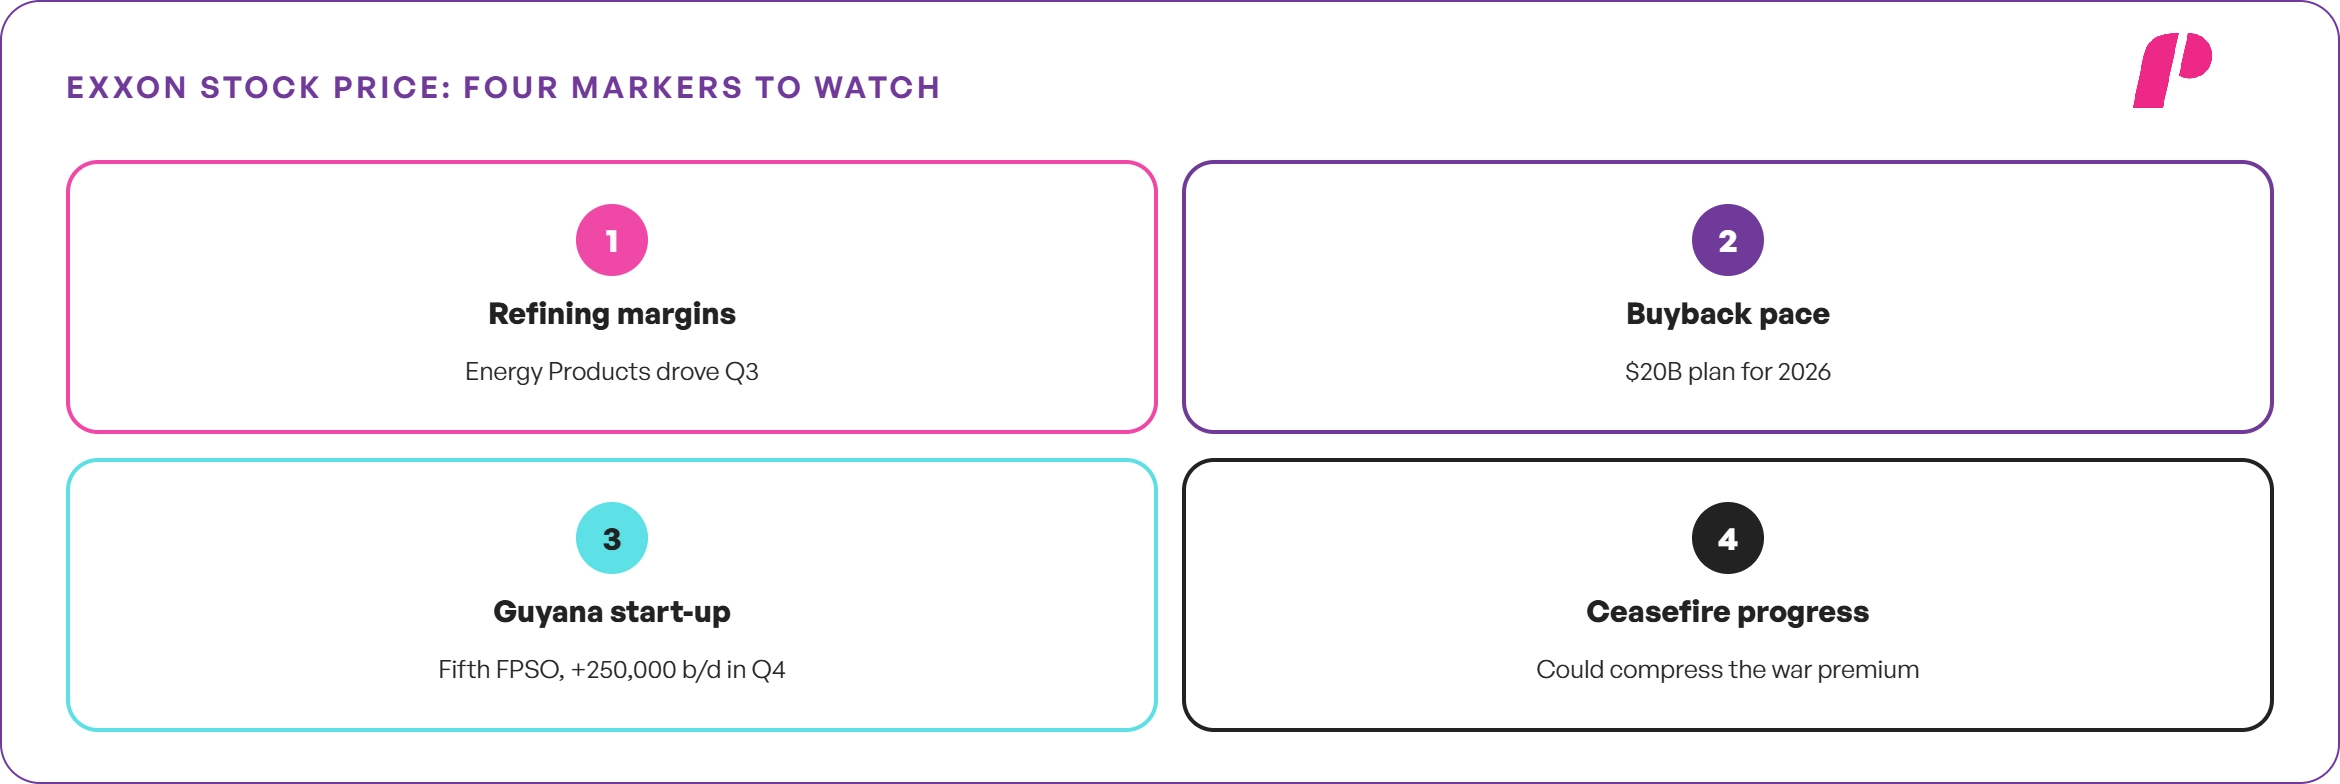
The question is what investors pay for that strength once the war premium fades. Watch four markers: refining margins, the buyback pace, the Guyana start-up, and any ceasefire progress.
In our view, Exxon’s Permian and Guyana growth justify a premium valuation. The current Exxon stock price, however, assumes oil stays near war levels for longer than history usually allows.
NFA. DYOR. This analysis is for informational purposes only and is not investment advice.
If you liked this post make sure to share it!