On October 14, Apple crossed the $5 trillion mark in terms of market value for the first time. After two weeks from then, Apple’s stock price is hovering around $344.
🔗What Is Market Capitalization?
Every advanced chip behind that valuation still comes from one company on one island. That tension runs through Apple’s story in 2026.
Sales growth has returned, and a new CEO has taken charge. The iPhone has also never been more expensive to build.
This analysis examines what drives the shares into the fiscal fourth-quarter report on Monday, November 2. It also explains why Taiwan remains the risk no balance sheet can fully hedge.
Where the Apple Stock Price Stands Before November 2
The shares trade near their 52-week high after a strong autumn. The iPhone 18 Pro launched in September, and the first foldable iPhone followed in October.
Both helped carry the stock through a weak stretch for big tech.
🔗Magnificent 7 Stocks: Where Investors Are Finding Growth in 2026
Apple Inc. (AAPL) Stock Price Markers & Technical Performance Benchmarks
| Apple Stock Price Marker / Technical Metric | Figure / Market Value |
|---|---|
| Closing Share Price (October 28, 2026) | $343.83 per share |
| Closing Share Price (October 27, 2026) | $347.10 per share (-0.9% pullback) |
| 52-Week Trading Range | $243.42 to $348.36 per share |
| Total Market Capitalization | About $5.0 Trillion |
| Trailing P/E Ratio (Gotrade) | About 39.0x |
| Fiscal Q4 2026 Earnings Report Schedule | November 2, 2026 (After Market Close) |
A trailing multiple near 39 times earnings is high for a company growing revenue in the low teens.
The market prices Apple as a growth company again, which raises the bar for Monday’s guidance.
Trader Takeaway: AAPL shares trade close to their highs within 1%. Results might have been priced in, which means that the quarter’s December outlook becomes more significant.
For traders, the $348.36 high is therefore the first level that a positive reaction would need to clear.
🔗12 Trade Management Golden Tips For Day Traders
The Numbers: Apple’s Growth Rebound
Fiscal 2025 marked a modest recovery. Fiscal 2026 turned it into real acceleration.
Apple Inc. (AAPL) Full-Year Financial Performance & Shareholder Returns
| Fiscal Year Metric (September Fiscal Year-End) | FY2024 Results | FY2025 Results |
|---|---|---|
| Total Net Sales | $391.0 Billion | $416.2 Billion |
| iPhone Segment Revenue | $201.2 Billion | $209.6 Billion |
| Services Segment Revenue | $96.2 Billion | $109.2 Billion |
| Total Operating Income | $123.2 Billion | $133.1 Billion |
| Net Income Attributable to Shareholders | $93.7 Billion | $112.0 Billion |
| Diluted Earnings Per Share (EPS) | $6.08 per share | $7.46 per share |
| Share Repurchases (Buybacks) | $94.9 Billion | $90.7 Billion |
FY2024 net income also included a non-recurring $10.2 billion tax expense related to the European state aid case. Excluding this, FY2025 EPS increased by around 10.5%.
🔗Earnings Per Share (EPS) Explained
The June quarter showed how far momentum has shifted.
Apple Inc. (AAPL) Fiscal Q3 (June Quarter) Financial Results & Segment Performance
| Fiscal Q3 Metric (June Quarter) | Q3 FY2025 Results | Q3 FY2026 Results | Year-Over-Year Change |
|---|---|---|---|
| Total Net Sales | $94.0 Billion | $109.4 Billion | +16.0% YoY |
| iPhone Segment Revenue | $44.6 Billion | $54.3 Billion | +22.0% YoY |
| Mac Segment Revenue | $8.0 Billion | $10.4 Billion | +29.0% YoY |
| Services Segment Revenue | $27.4 Billion | $30.7 Billion | +12.0% YoY |
| Greater China Regional Sales | $15.4 Billion | $18.8 Billion | +22.0% YoY |
| Diluted Earnings Per Share (EPS) | $1.57 per share | $2.02 per share | +29.0% YoY |
Greater China returned to growth after shrinking in fiscal 2025. The Mac grew 29%, while the iPad slipped 6%.
In July, Apple raised Mac and iPad prices, citing component costs. The stock dipped on the news, then recovered within days.
iPhone growth of 22% shows the product cycle, not just Services, now drives Apple’s earnings.
🔗Apple Earnings Report Q2 FY2026
Trader Takeaway: Apple has returned to double-digit growth. Sustaining it depends on iPhone 18 demand holding up despite higher prices.
As a result, any comment on iPhone 18 demand during Monday’s call may move the shares more than the September figures themselves.
Memory Costs and the Margin Question
The June quarter’s 50.1% gross margin flattered the picture. About two points came from tariff refunds.
In February, the Supreme Court ruled the IEEPA reciprocal tariffs unlawful. Products margin reached 40.1%, including a 2.5-point refund benefit.
🔗Tariffs and Stocks
Memory is now the main pressure. Apple paid more for DRAM in each successive quarter this year and expects costs to rise again.
Tim Cook called it “a 100-year flood on memory pricing.” In response, Apple said it “reluctantly raised prices” on some products.
🔗Micron (MU): How Long Can Its 87% Margins Last?
Apple Inc. (AAPL) Gross Margin Drivers & Operating Expense Guidance
| Margin Driver & Financial Metric | Q3 FY2026 Actual Results | Q4 FY2026 Corporate Guidance Range |
|---|---|---|
| Total Gross Margin Percentage | 50.1% | 47.0% to 48.0% |
| Tariff Refund Benefit Impact | About 2.0 percentage points | About 1.0 percentage point |
| Top-Line Revenue Growth Rate | +16.0% YoY | +9.0% to +11.0% YoY |
| Operating Expenses (OpEx) | Not applicable / Not disclosed separately | $19.1 Billion to $19.4 Billion |
The Mechanism is Direct:

TrendForce estimated steep memory inflation for a 256GB Pro iPhone. By the third quarter of 2026, module costs would run nearly 400% above a year earlier. Apple’s pricing power now faces its toughest test in years.
🔗How to Read an Earnings Report
Trader Takeaway: Tariff refunds are fading while memory costs climb. Gross margin guidance for the December quarter will show how much of the squeeze Apple can pass on.
In simpler terms, a margin guide below 47% is the number most likely to put pressure on the stock.
The Taiwan Concentration
While Apple designs its processors, the company does not manufacture them. All A-series and M-series processors are manufactured by TSMC, and the leading-edge fabrication occurs in Taiwan.
Reports indicate the iPhone 18 Pro’s A20 Pro chip uses TSMC’s 2nm process, built first on the island.
Apple Inc. (AAPL) Global Supply Chain Architecture
| Supply Chain Layer / Operational Tier | Primary Geographic Location & Foundry Partner | Geopolitical Risk Exposure & Concentration Vulnerability |
|---|---|---|
| Leading-Edge Chip Fabrication (SoCs) | Taiwan — Taiwan Semiconductor Manufacturing Co. (TSMC) | Extreme single-foundry and single-island geopolitical exposure |
| Secondary Chip Fabrication | Arizona, United States (TSMC domestic fabs) | Smaller operational scale, weighted toward older process nodes |
| Sub-Component & Material Supply | Mainland China (regional component clusters) | High concentration in displays, precision machining, batteries, and modules |
| Final Device Assembly & Packaging | China, India, and Vietnam (multi-hub footprint) | Actively diversifying under China+1 strategy, but still China-heavy |
Diversification has progressed at the assembly stage. India and Vietnam now build a growing share of iPhones, AirPods and other devices.
🔗AI Infrastructure and Semiconductor Stocks in 2026
Upstream components, however, still flow largely from mainland China. A disruption in the Taiwan Strait would therefore hit both chips and parts.
Reports in 2024 said ASML and TSMC could remotely disable advanced lithography machines in an invasion.
🔗ASML Stock Price: Innovating the Future of Tech
Then-TSMC chairman Mark Liu told CNN that a military invasion would render TSMC’s factories non-operable.
That limits what an aggressor could seize. It does nothing to keep Apple’s chip supply running. No alternative foundry can produce Apple’s most advanced chips at scale on short notice.
Apple does not carry this risk alone. Nvidia, AMD, Qualcomm, and Broadcom depend on the same foundry. A Taiwan crisis would hit the entire technology sector, not Apple alone.
🔗Nvidia Earnings Reports: The Power Play Behind Vera Rubin
Trader Takeaway: There are risks such as the Taiwanese situation that pose a low-probability but high-impact risk to the market. Arizona capacity reduces it only at the margin.
For traders, however, it tends to appear as sudden headline risk rather than as a factor in earnings week.
Silicon as the Moat
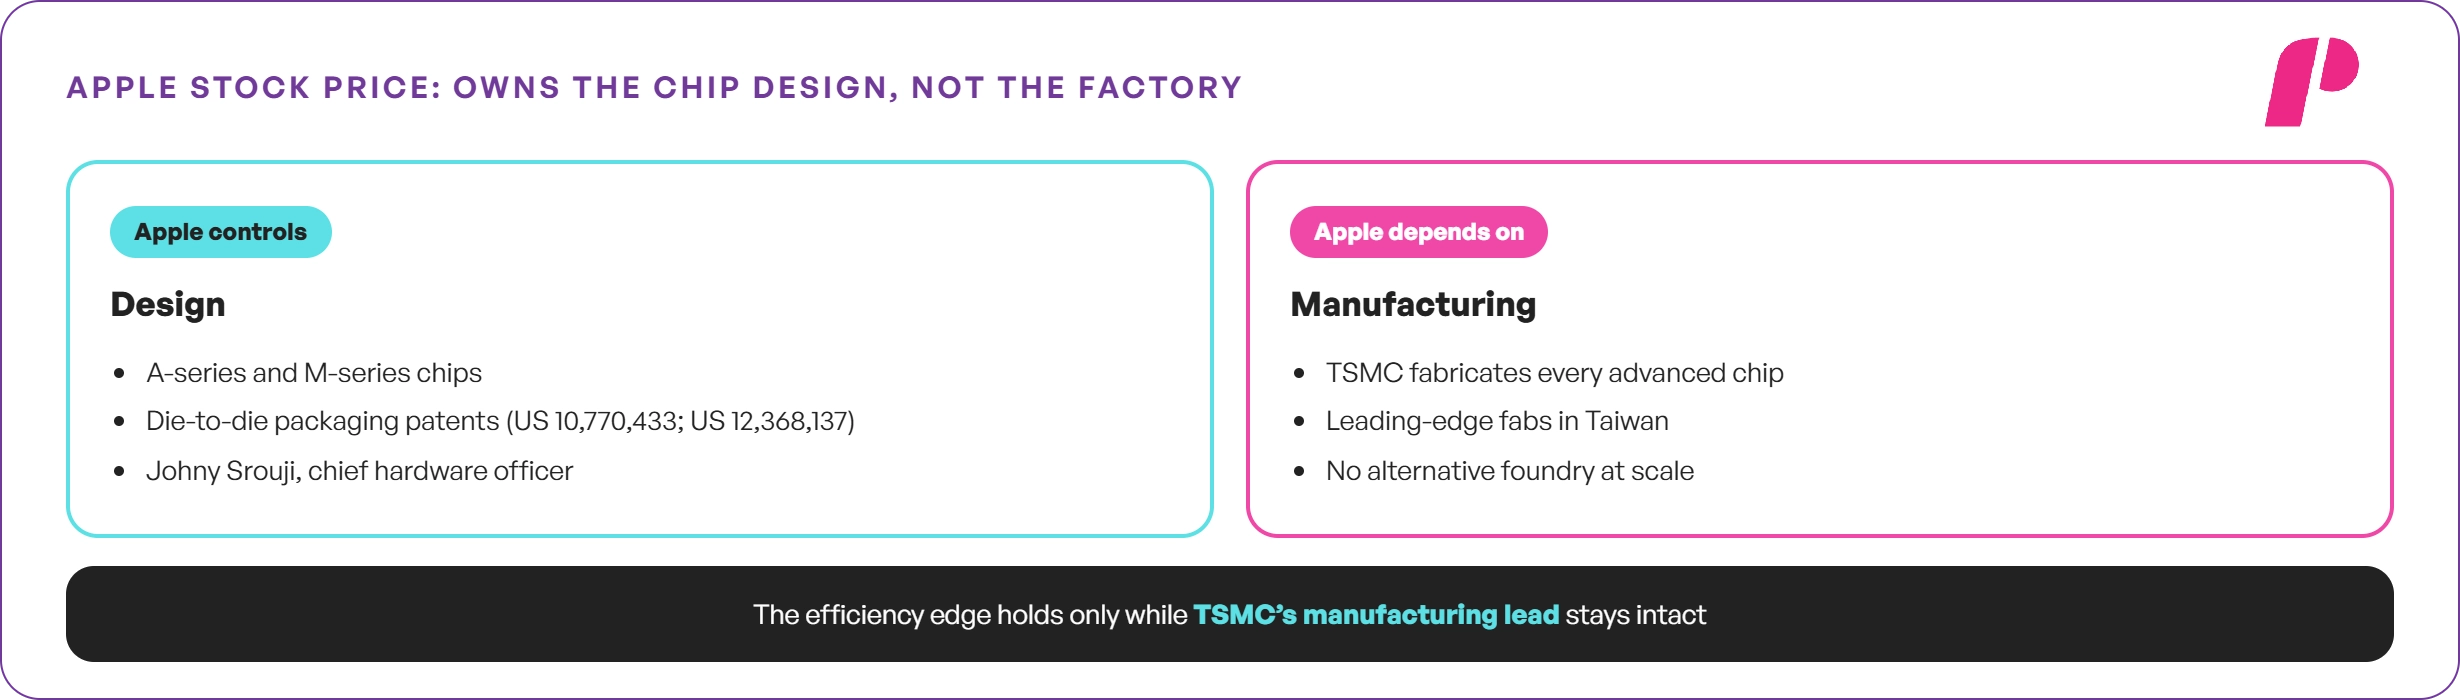
Apple’s custom chips remain its strongest technical advantage. The M-series family ended Apple’s reliance on Intel and set new standards for performance per watt.
🔗Intel’s Sovereign Chipmaker Pivot: SHIELD, Tan and Trump
Some of its advantage is protected by a packaging patent. For instance, US Patent Number 10,770,433 owned by Apple Inc. is about a high-bandwidth die-to-die connection.
That approach underpins how Apple links two chips into one larger processor in its Ultra-class Macs. A related Apple patent, US 12,368,137, followed in 2025.
🔗Patent Portfolios and IP Moats
In April, Apple named Johny Srouji chief hardware officer. He is responsible for chips, batteries, cameras, and displays. The company has complete control over its chip design but not its manufacturing facilities.
Trader Takeaway: Silicon design keeps Apple ahead of Android rivals on efficiency. That advantage depends on TSMC’s manufacturing lead staying intact.
AI: Partnering Instead of Spending
Apple has committed $12.7 billion towards capital spending in fiscal 2025. Each of Microsoft, Alphabet, Amazon, and Meta has plans for spending well over $100 billion this year. Apple chose a different path.
Google Cloud chief Thomas Kurian confirmed in April that Gemini will power a more personalized Siri later this year. Google called itself Apple’s “preferred cloud provider.”
According to Bloomberg, Apple would pay about $1 billion a year for the custom model. Apple runs a hybrid setup of third-party cloud and its own Private Cloud Compute servers.
Strategic Artificial Intelligence Approaches
| Strategic AI Pillar | Apple Inc. (AAPL) Approach | Major Hyperscalers (Microsoft, Meta, Amazon, Google) |
|---|---|---|
| Capital Spending (CapEx) Intensity | $12.7 Billion (FY2025) — Restrained, asset-light infrastructure model | Over $100.0 Billion each (2026 plans) — Massive data center & compute build-out |
| Frontier AI Model Development | Partner-driven / Licensed models (e.g., Google Gemini integration) | Built entirely in-house (proprietary foundational LLMs) |
| Primary Monetization Mechanism | Hardware device upgrades & potential premium paid iCloud+ tiers | Cloud infrastructure rental, enterprise software subscriptions, & digital ads |
The choice is obvious; Apple escapes the cash flow crunch faced by all its competitors. It also gives up some control over its most visible AI feature.
🔗AI Stocks in 2026: How to Evaluate, Choose, and Trade
Apple is betting that owning the device matters more than owning the model.
Trader Takeaway: Low AI capex protects Apple’s buybacks. The risk is dependence on a rival for a core software experience.
On the other hand, any delay to the new Siri could weigh on sentiment around the upgrade cycle.
🔗Stock Buybacks Explained
Services and Regulators
Services grew 12% to $30.7 billion in the June quarter at a 75.6% gross margin. Default search payments from Google, reported at more than $20 billion a year, form part of that profit pool.
That revenue survived the Google antitrust case. In September 2025, Judge Amit Mehta allowed Google to keep paying Apple.
The deals must be non-exclusive and last one year. The Justice Department has appealed for tougher remedies.
🔗Google Stock Prices: What Will Happen if Chrome is Sold?
Apple faces its own monopolization suit from the Justice Department, which survived a motion to dismiss in June 2025.
In Europe, Digital Markets Act rules continue to force changes to App Store terms. Apple noted that App Store regulatory changes as well as slower mobile gaming affected Services.
🔗How Lawsuits and Regulatory Fines Move Stocks
Apple Inc. (AAPL) Services Segment Financial Performance
| Services Financial Metric & Performance Dimension | FY2024 Results | FY2025 Results | Q3 FY2026 Results |
|---|---|---|---|
| Services Total Net Sales | $96.2 Billion | $109.2 Billion | $30.7 Billion (Single Quarter) |
| Services Segment Gross Margin Percentage | 73.9% | 75.4% | 75.6% |
| Share of Total Company Net Sales | 24.6% | 26.2% | 28.1% |
Services margins sit roughly double those of hardware. Each point of mix shift toward Services lifts group profitability, which partly offsets memory inflation. Regulation trims Services growth but has not broken the model.
Trader Takeaway: Services remains the margin anchor. The annual renegotiation of Google payments adds a recurring, if modest, uncertainty.
Leadership Transition
John Ternus became CEO on September 1. Tim Cook moved to executive chairman, focusing on policymakers. Monday’s call will be Ternus’s first as chief executive.
Cook sold about $63.8 million of stock on October 2 under a Rule 10b5-1 plan adopted in May. The sale followed the vesting of a performance award tied to Apple’s relative shareholder return.
His trust still holds about 3.24 million shares. The sale signals routine diversification rather than a view on the business.
🔗Insider Trading and Form 4 Filings Explained
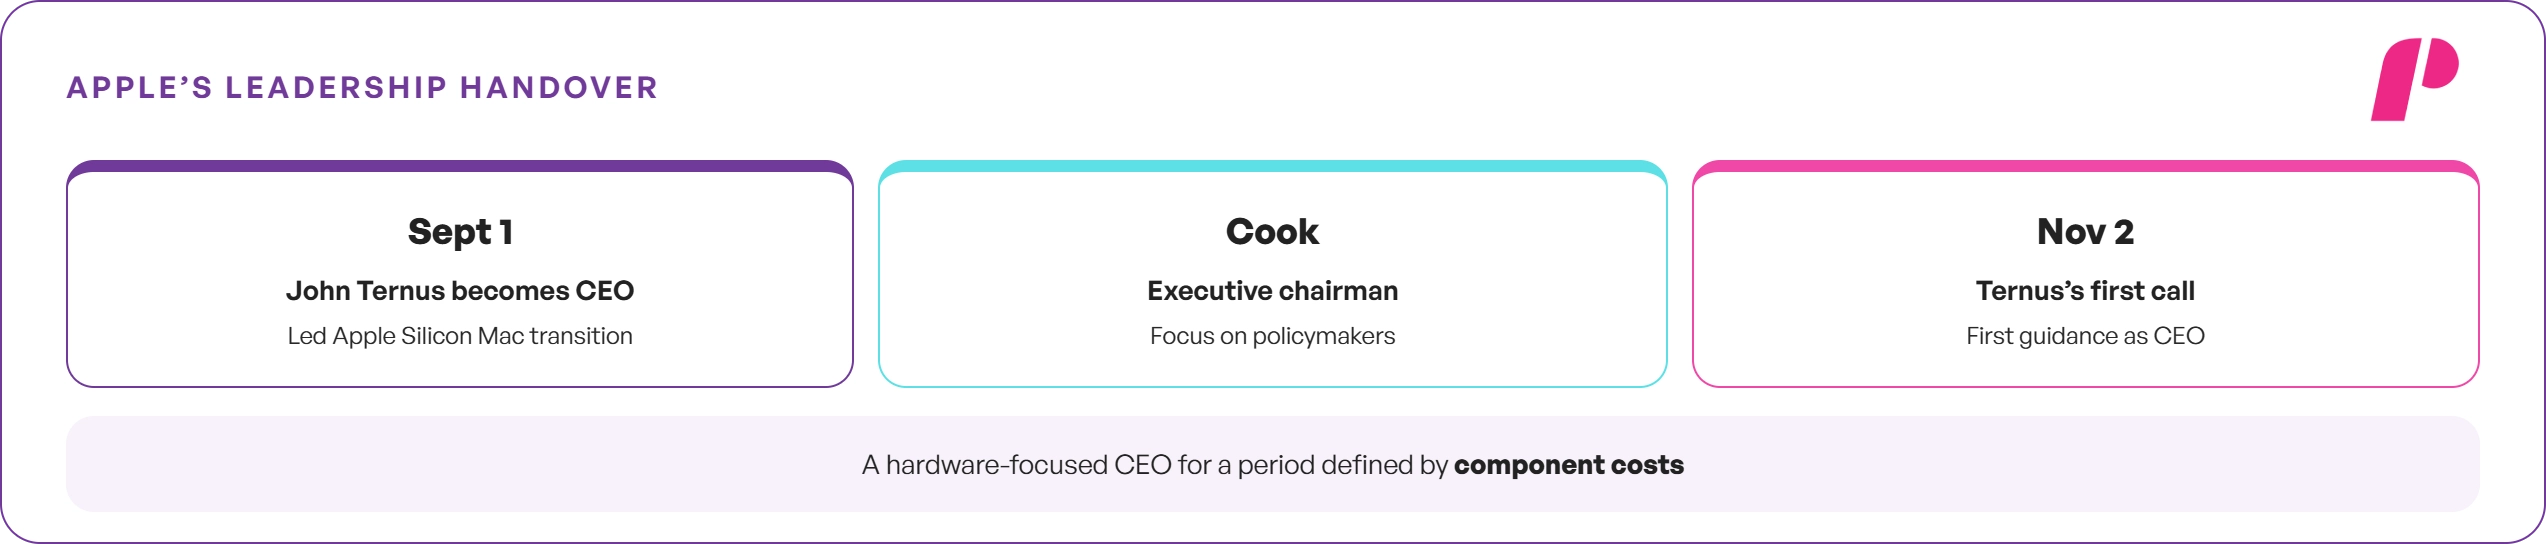
The handover matters for strategy. Ternus was responsible for the hardware engineering division that included the transition to Apple Silicon Macs.
This is the right step, as product cost and design compromises now reign supreme in terms of margin concerns.
Trader Takeaway: A hardware-focused CEO fits a period defined by component costs. Ternus’s first guidance will set the tone for his tenure.
Therefore, the tone of Monday’s call may matter as much as the numbers themselves.
What Options Imply for November 2
Guidance from Apple suggests that the company expects revenues in the range of $111.7 billion – $113.7 billion for Q4F. The consensus expectation stands at around $113.3 billion and $1.99 per share.
Only nine days of iPhone 18 Pro sales fall in the quarter. The iPhone Duo foldable, priced from $1,999, went on sale October 23 and lands in the December quarter.
The Expected Move Formula is:

Apple’s post-earnings moves have often stayed in single digits. Using a hypothetical 4% implied move, $343.83 × 0.04 = about $13.75. That implies a range of roughly $330 to $358. Live options data will differ.
🔗Options Expected Move Explained
Position size can follow the same logic. For instance, when someone uses trading capital worth $100,000 and a risk percentage of 1%, then the risked amount would be $1,000.
In case of the stop just one move away, the trade size becomes $1,000 ÷ $13.75 = 73 shares. This is an illustration, not a trade plan.
🔗Position Sizing in Forex & Stocks
Apple Inc. (AAPL) Earnings Scenario Planning & Stock Price Action Triggers
| Market Scenario | Forward Guidance & Fundamental Signal | Likely Effect on Stock Price Action & Technical Levels |
|---|---|---|
| Constructive Scenario | December-quarter revenue guidance exceeding the $153.0 Billion consensus; gross margin holding resilient near 47.0%–48.0% despite component pressures | Upside momentum pushing for a retest of the $348.00 high and moving toward options-implied resistance near $355–$360 |
| Base Case Scenario | Guidance tracking strictly in line with expectations; rising memory chip cost pressures and supply headwinds flagged by executive management | Range-bound consolidation hovering near current technical levels ($339.50 to $348.22 band) |
| Pressured Scenario | Gross margin guidance dropping below 46.0% or softening unit sell-through reported across flagship iPhone lines | Post-earnings profit-taking pullback toward immediate support near $330.00 |
These thresholds reflect our judgment, not company guidance. December-quarter guidance and the memory outlook will matter more than the September numbers.
Trader Takeaway: Guidance already frames the September quarter. The market will trade on Ternus’s first outlook for the holiday quarter.
The Risks That Matter for the Apple Stock Price
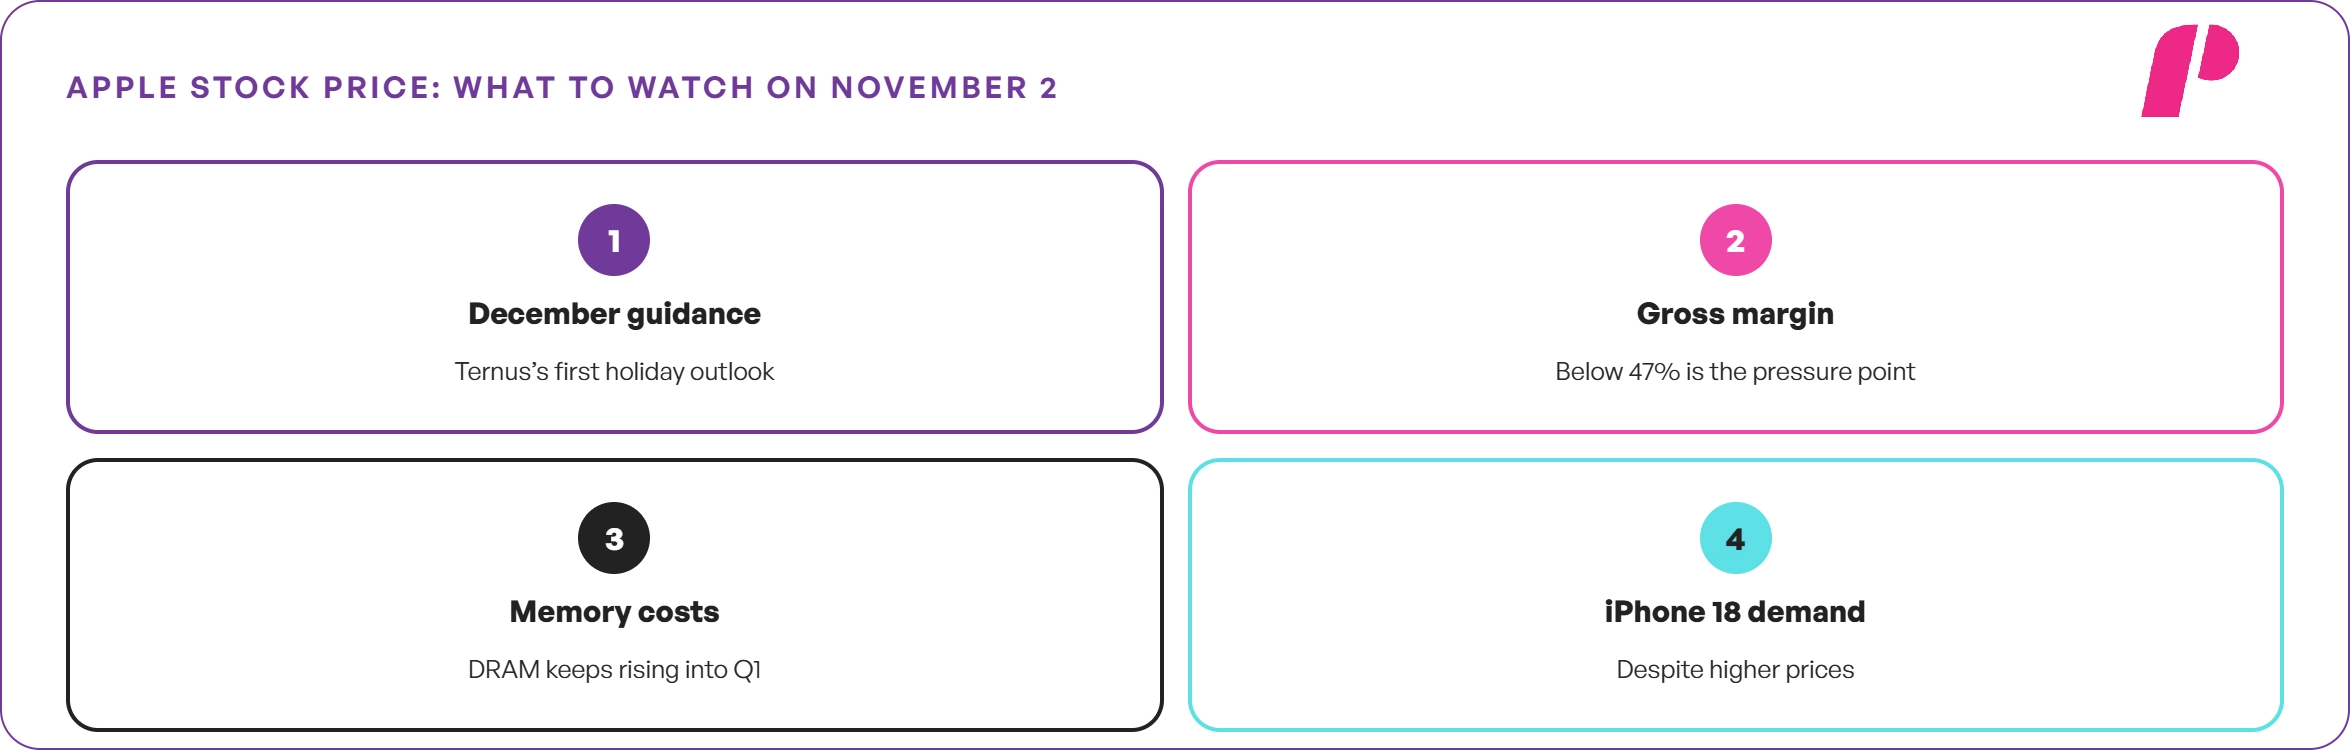
Each of the risks below can show up in Monday’s numbers, in the guidance, or on the call itself.
- Taiwan concentration. TSMC fabricates all of Apple’s advanced chips.
- Memory inflation. DRAM costs keep rising into the holiday quarter.
- Fading tariff relief. Refund benefits shrink from about 2 points to about 1 point.
- Valuation. A trailing P/E near 39 leaves little room for a miss.
- AI dependence. Gemini powers the next Siri.
- Regulation. The DOJ suit, the DMA, and the Google search appeal remain open.
- Price elasticity. Higher iPhone prices may slow unit demand.
🔗Risk Management in Stocks: A Complete Guide 2026
Closing Thoughts
Apple comes into November in the strongest shape it has been in years, with revenue growth back above 10%, iPhone cycle acceleration, and the stock passing $5 trillion.
An effective AI strategy ensured that spending was kept in check when other firms were investing heavily in their data centers.
The vulnerabilities sit in the supply chain. Memory costs are squeezing margins, tariff refunds are fading, and every advanced chip still comes from Taiwan.
The Apple stock price reflects a company that has solved its growth problem but not its concentration problem.
In our view, Apple’s balance sheet and brand can absorb most shocks. A crisis in the Taiwan Strait is the one it cannot buy its way out of.
NFA. DYOR. This analysis is for informational purposes only and is not investment advice.
If you liked this post make sure to share it!