Large-cap stocks appear somewhere in nearly all stock screeners, fund pages, and market headlines. Nearly all guides describe large-cap stocks with one number – $10 billion in market value. This is very convenient; however, it misses a lot.
For example, FINRA uses $10 billion. Meanwhile, FTSE Russell’s 2026 breakpoint, set from April 30 rankings, landed near $5.7 billion. Over at S&P Dow Jones Indices, the bar sits higher still: no company gets added to the S&P 500 below $22.7 billion, and that’s been the case since July 1, 2025. Three sources, three lines.
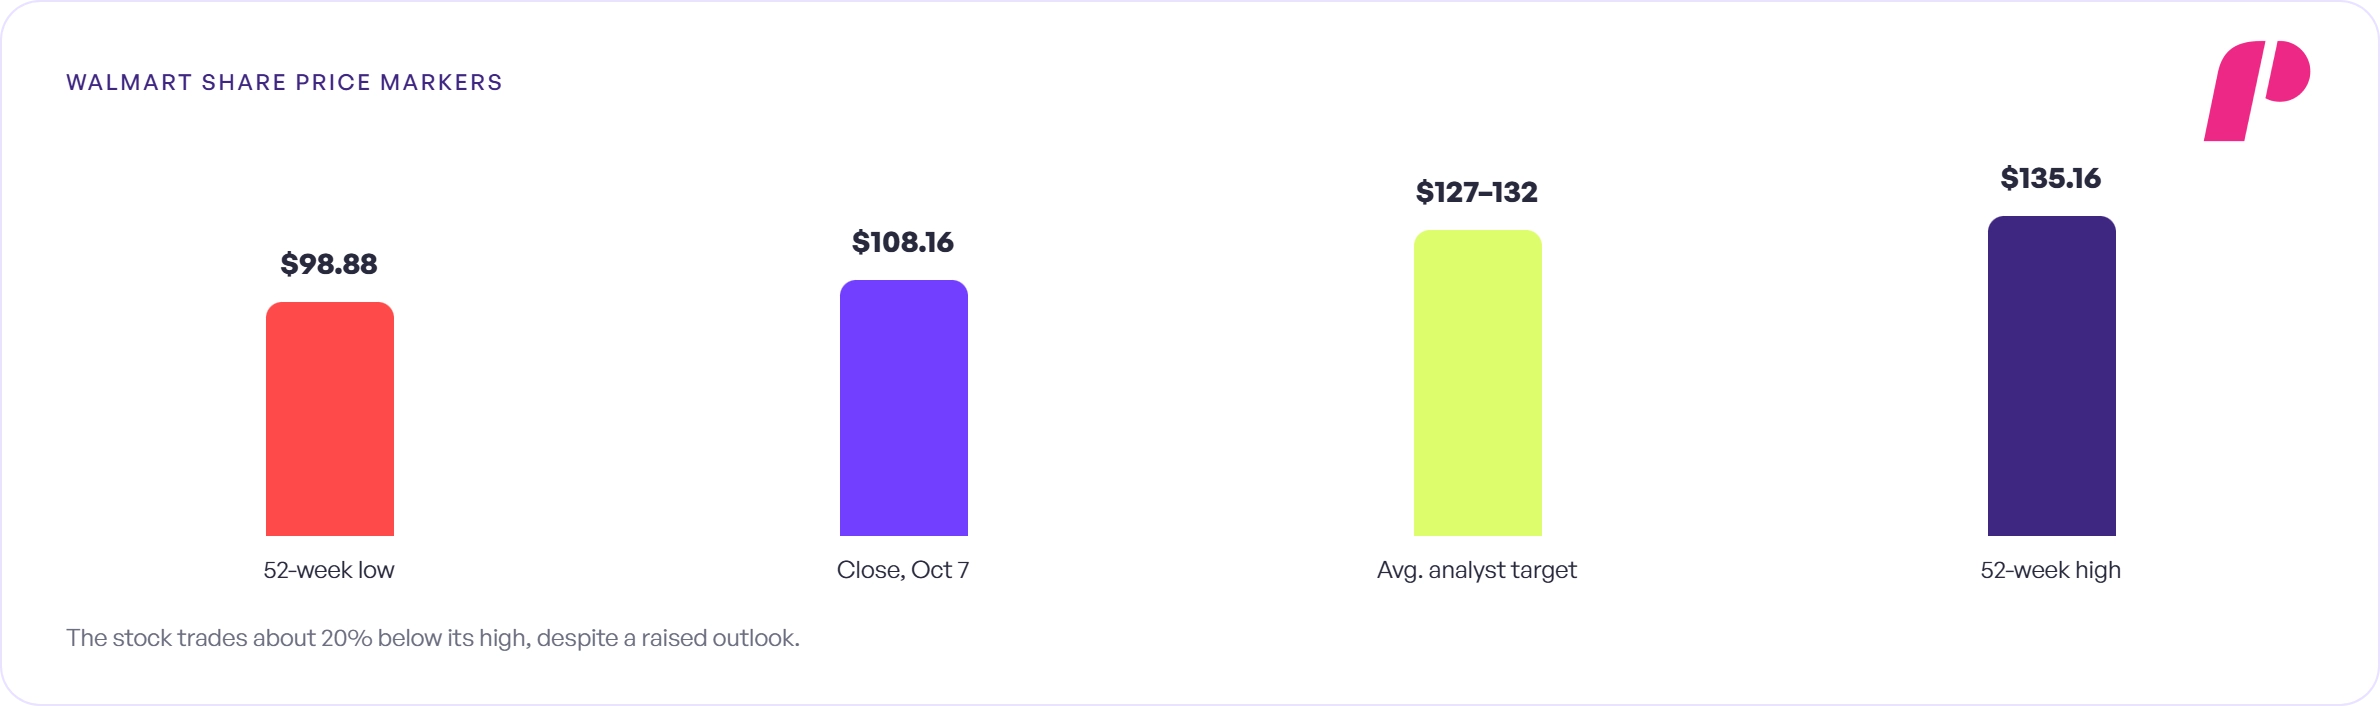
Why does this matter to a trader? The fact is, an asset name used literally may confuse a trader’s perceptions of liquidity, risk, and index exposure within his portfolio.
Checking where this name comes from is easy and fast (it takes just one minute, and often less). In this article, we will run through this check and apply it to actual trading in a funded account.
What Does Large Cap Mean, and Is $10 Billion The Official Line?
Fund fact sheets, broker tools, and financial news refer to it all the time without bothering to explain it. So what does a large cap mean? In simpler terms, large-cap firms are companies whose market capitalization is very high, ranging from tens to hundreds of billions of dollars.
And is $10 billion the official large-cap threshold? No. Nobody owns the definition, so FINRA, FTSE Russell, and S&P each draw their own line. A firm worth $15 billion is considered a mid-cap by FINRA, but not large enough for the S&P 500.
Size is something to verify here rather than a given.
The sections below line up large, mid, and small caps against each other, name real companies with 2026 dates attached, look at where the giants can hurt a portfolio, and end on a short pre-trade checklist written with funded stock accounts in mind.
Takeaway:
- What large-cap stocks are, and the simple math behind market cap
- Whose definitions serve as the cutoff—FINRA’s, FTSE Russell’s, or S&P’s — and why they disagree
- The differences between large cap, mid cap, and small cap companies with 2026 examples
- The main risks, including concentration in seven giant stocks.
- How traders use large caps inside a funded stock account.
What Are Large-Cap Stocks?
Large-cap stocks refer to stocks from the largest publicly traded corporations on the stock exchange, depending on market capitalization.
Two frequent queries raised by novice investors regarding large-cap stocks are as follows: What are large-cap stocks? Why do stock brokers and money managers isolate them from each other? And the answer lies in the fact that when size matters, behavior also does.
A big company’s shares usually change hands more easily, more analysts follow its results, and news tends to move it in a different way than it moves a small name.
🔗 What Is Market Capitalization?
How Market Capitalization Works
Market capitalization, or market cap, is the number behind that size. How is market capitalization calculated? Share price times shares outstanding. The worth of the business entity whose stock prices have been valued at $150 with 200 million outstanding shares is $30 billion.
The first characteristic pointed out by FINRA (September 30, 2022) is the inclusion of the restricted stock held by insiders in determining the number of shares outstanding.
🔗 What Are Shares Outstanding?

Market Cap Worked Example: One Formula, Three Different Labels
| Company | Share Price | Shares Outstanding | Market Capitalization | Size Classification & Index Result |
|---|---|---|---|---|
| Company A | $150.00 | 200,000,000 | $30.0 billion | Large cap across all three testing frameworks |
| Company B | $40.00 | 300,000,000 | $12.0 billion | Large for FINRA and Russell; below S&P 500 minimum |
| Company C | $25.00 | 200,000,000 | $5.0 billion | Mid-cap for FINRA; below Russell breakpoint threshold |
Hypothetical example; size test only (S&P also applies float, liquidity, and profit tests).
Mega-Cap And Blue-Chip Stocks
Then, at the top end, there’s another label. What is a mega-cap stock, and is that the same as a blue chip? Not really. FINRA calls anything worth $200 billion or more a mega-cap. In contrast, blue chip has nothing to do with size; it’s about reputation and a long track record. A blue chip can be a large cap, but size alone doesn’t make one.
What Is Considered A Large-Cap Stock?
FINRA: The $10 Billion Line
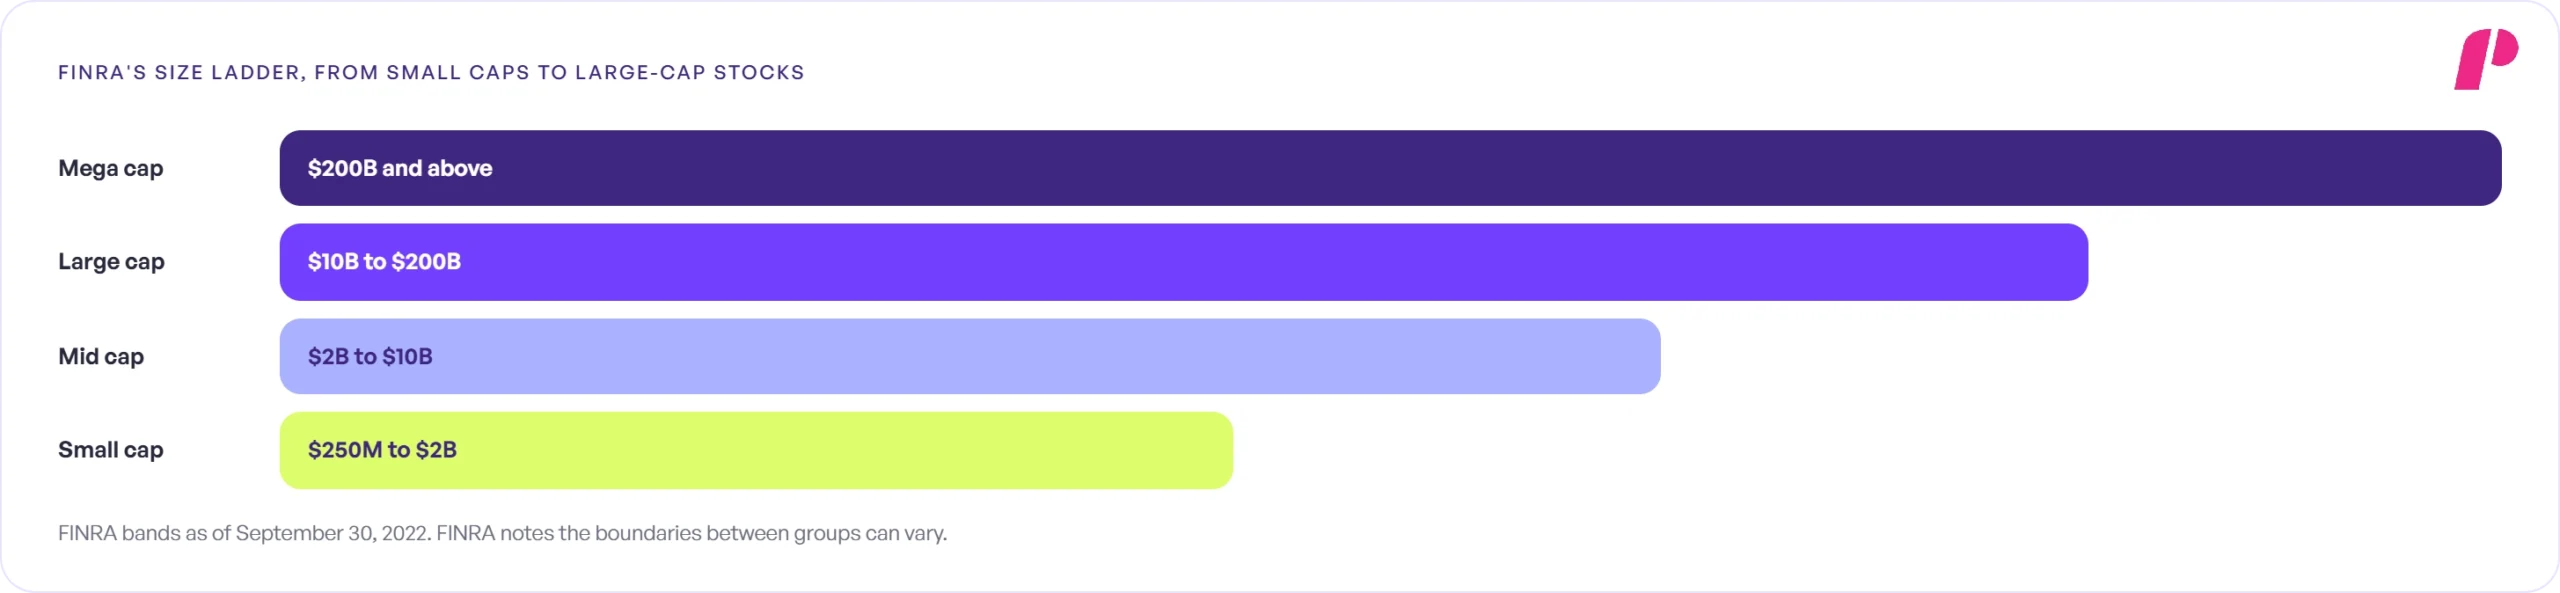
FINRA, the regulator that oversees US broker-dealers, admits the boundaries between size groups can vary. So what is considered a large-cap stock under FINRA’s version? Anything from $10 billion to $200 billion. Above that, it’s mega-cap.
FTSE Russell: The Russell 1000 Breakpoint
However, FTSE Russell does it differently. It ranks every eligible US company by market cap before each reconstitution and draws the line from that ranking. What is the Russell 1000, and where does its large-cap group stop? It’s FTSE Russell’s large-cap index.
After the April 30, 2026 ranking, the breakpoint between it and the Russell 2000 sat near $5.7 billion, up from $4.6 billion a year earlier. There’s some give in the system, though.
A retention band, roughly $2.7 billion to $9.6 billion this year, lets companies near the line stay put, so 111 Russell 1000 members ended up below the breakpoint and kept their place anyway, according to preliminary data.
🔗 Russell Reconstitution Explained
S&P Dow Jones Indices: The S&P 500 Minimum
Meanwhile, the S&P Dow Jones Indices has the highest threshold. Is the S&P 500 a large-cap index, and what size must the company be to join? Yes, and from July 1, 2025, the entry criterion will be that the market capitalization should be at least $22.7 billion. That’s for new additions only.
However, size alone won’t get a company in, either. S&P also looks at float, trading liquidity, and whether the business is profitable, while a stock that’s already a member can slide under $22.7 billion and keep its seat. S&P reviews the range each quarter, and as of the June 30, 2026 factsheet, it hadn’t moved.
Large-Cap Cutoffs By Source
| Index / Regulatory Source | Large-Cap Threshold Line | Related Market Capitalization Bands | Effective Date / Rank Day |
|---|---|---|---|
| FINRA | $10 billion to $200 billion | Mega: $200B+; Mid: $2B to $10B; Small: $250M to $2B | Sep 30, 2022 |
| FTSE Russell | About $5.7 billion breakpoint (Russell 1000 above / 2000 below) | Retention band: about $2.7 billion to $9.6 billion | Apr 30, 2026 rank day |
| S&P Dow Jones Indices | $22.7 billion or more (S&P 500 additions) | MidCap 400: $8.0B–$22.7B; SmallCap 600: $1.2B–$8.0B | Jul 1, 2025 |
When lined up side-by-side, it becomes clear that the subsequent question is one of how the large caps stack up to the smaller ones.
Large-Cap Stocks Vs. Mid-Cap Stocks Vs. Small-Cap Stocks
Difference Among Them In A Nutshell
The size of the organization determines how it will trade its shares, how many analysts will be tracking the organization, and the volatility caused by earnings surprises.
Are you able to distinguish between large-cap stocks and mid-cap stocks or small-cap stocks during trades? For example, you can use the definitions by FINRA for dollar banding. Large-cap: $10 billion – $200 billion. Mid-cap: $2 billion – $10 billion. Small-cap: $250 million – $2 billion.
FINRA also says large caps tend to ride out market swings better than small caps, partly because bigger companies usually have deeper financial reserves to fall back on.
🔗 What Are Mid-Cap Stocks?
Size Leadership Rotates
Holding up better isn’t the same as doing better. So which comes out ahead over the long run, large caps or small caps? It depends on which years a trader compares.
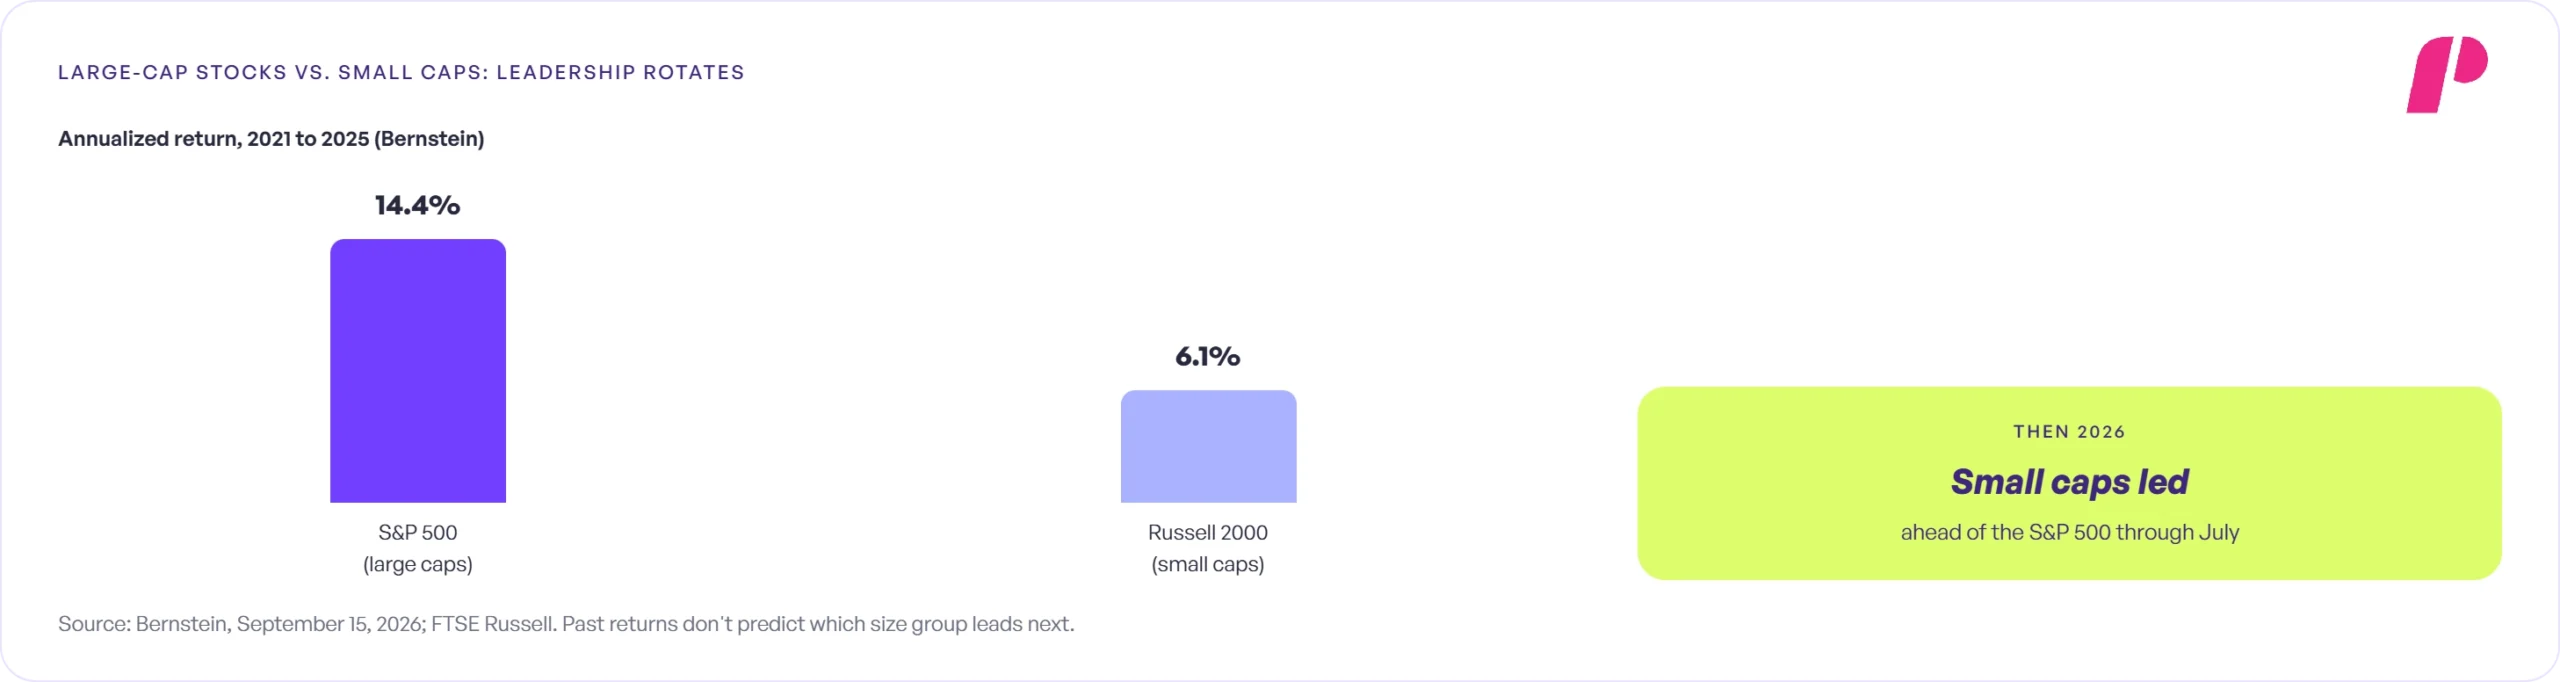
Bernstein’s figures, published September 15, 2026, have the S&P 500 up 14.4% a year from 2021 to 2025, while the Russell 2000 managed 6.1%.
Then 2026 turned that around. In fact, small caps beat the S&P 500 through July, Bernstein says, and FTSE Russell’s data has the Russell 2000 ahead of the Russell 1000 in the year to April 30.
Worth knowing: the Bernstein authors run small-cap strategies, so their outlook is one view. Still, the return figures are what count here.
Large-Cap Vs Small-Cap Stocks: How The Size Groups Compare
| Feature / Metric | Large Cap | Mid Cap | Small Cap |
|---|---|---|---|
| FINRA Band Thresholds | $10 billion to $200 billion | $2 billion to $10 billion | $250 million to $2 billion |
| Typical Volatility (FINRA) | Lower volatility profile | Moderate volatility profile | Higher volatility profile |
| Market Liquidity | Usually deepest liquidity | Moderate liquidity | Often thinner trading liquidity |
| Primary Index Benchmarks | S&P 500, Russell 1000 | S&P MidCap 400 | Russell 2000 |
Overall, this is a general trend, and any individual firm can be an exception.
Large-Cap Stocks Examples In 2026
A table of cutoffs only goes so far; company names make it concrete. Ask for examples of large-cap stocks, or for the largest company by market cap, and the answer starts with Nvidia.
For instance, FTSE Russell’s April 30, 2026 ranking put it first at $4.8 trillion, ahead of Alphabet, Apple and Microsoft. Then, by October 6, Motley Fool data put Nvidia near $5.8 trillion. Every company in Table 4 clears every cutoff by a wide margin, which puts all five megacaps under FINRA’s bands.
Large-Cap Stock Examples: The Five Largest Companies By Market Cap
| Global Rank | Company Name | Market Capitalization | Valuation Date |
|---|---|---|---|
| 1 | Nvidia Corporation | $5.8 trillion | Oct 6, 2026 |
| 2 | Apple Inc. | $4.9 trillion | Oct 6, 2026 |
| 3 | Alphabet Inc. | $4.2 trillion | Oct 6, 2026 |
| 4 | Microsoft Corporation | $3.9 trillion | Oct 6, 2026 |
| 5 | Amazon.com, Inc. | $2.7 trillion | Oct 6, 2026 |
Source: Motley Fool Research (live data, rounded). Figures move every trading day; the list shows size only and isn’t a buy list.
Knowing who qualifies is step one. Then, getting exposure is step two.
How To Invest In Or Trade Large-Cap Stocks
Individual Large-Cap Shares
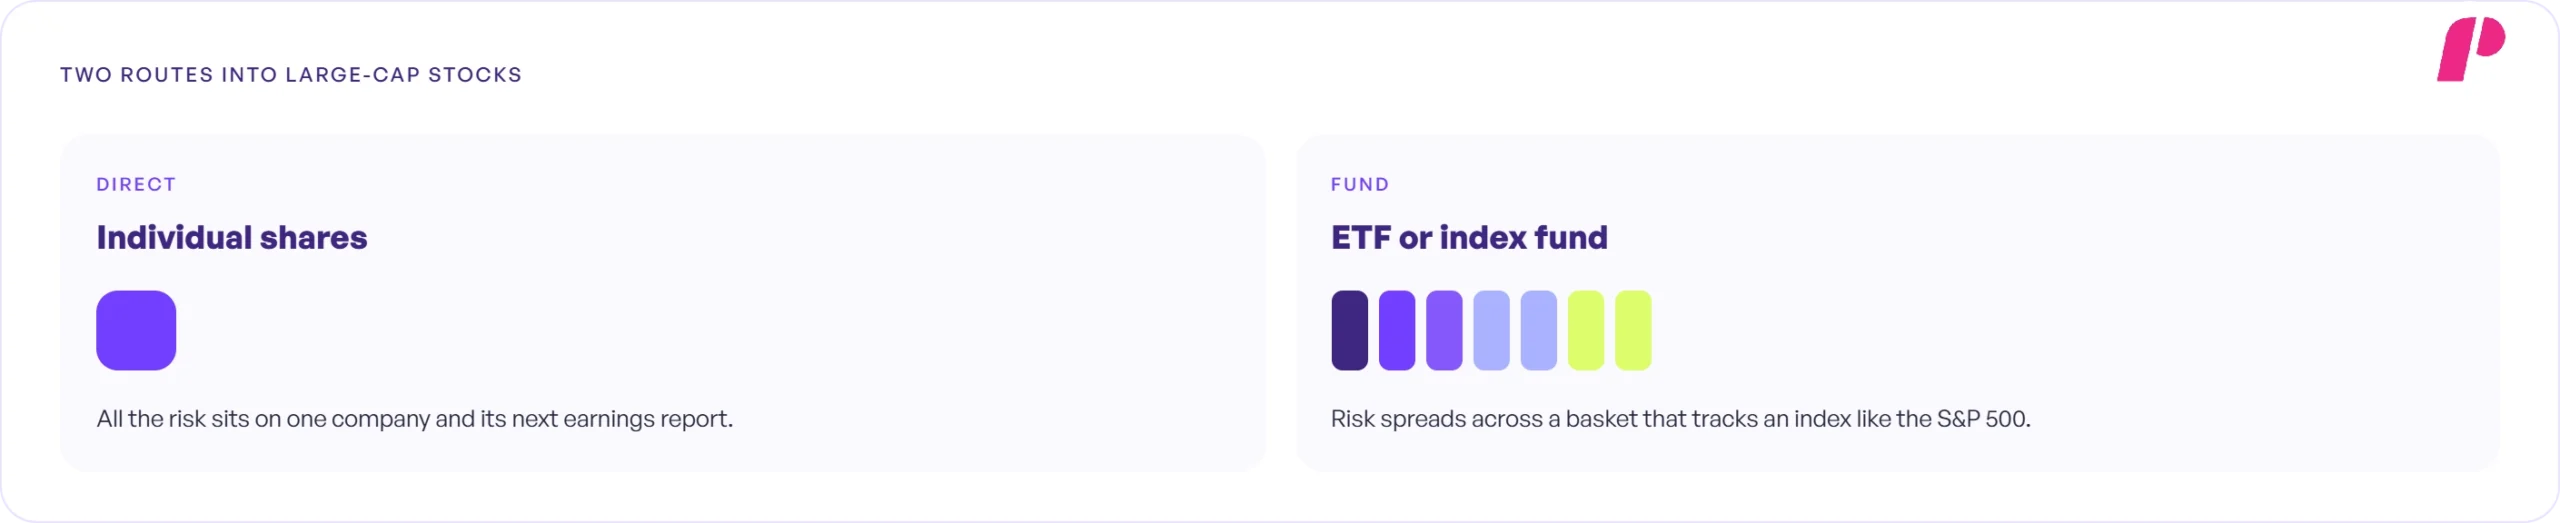
There are two basic ways in, and they carry different risks. How do you invest in large-cap stocks without making it complicated? First, the direct route is buying individual shares through a brokerage account. However, that puts all the risk on one company and whatever its next earnings report says.
Large-Cap ETFs and Index Funds
In contrast, the other way is through funds, where the money is dispersed among several companies at the same time. What is the definition of the large-cap ETF/index fund, and how does it work based on the performance of the market?
Every ETF or index fund is a portfolio of big companies selected in a way to mimic the performance of a particular index, such as the S&P 500 or the Russell 1000 index, so that it follows the performance of that index (lower costs), except for the issue of trading.
Growth, Value, And Dividend Large Caps
Large caps also fall into growth and value stock styles, and this categorization shows in the way they reward their stockholders. However, not all large-cap stocks provide dividends to their holders.
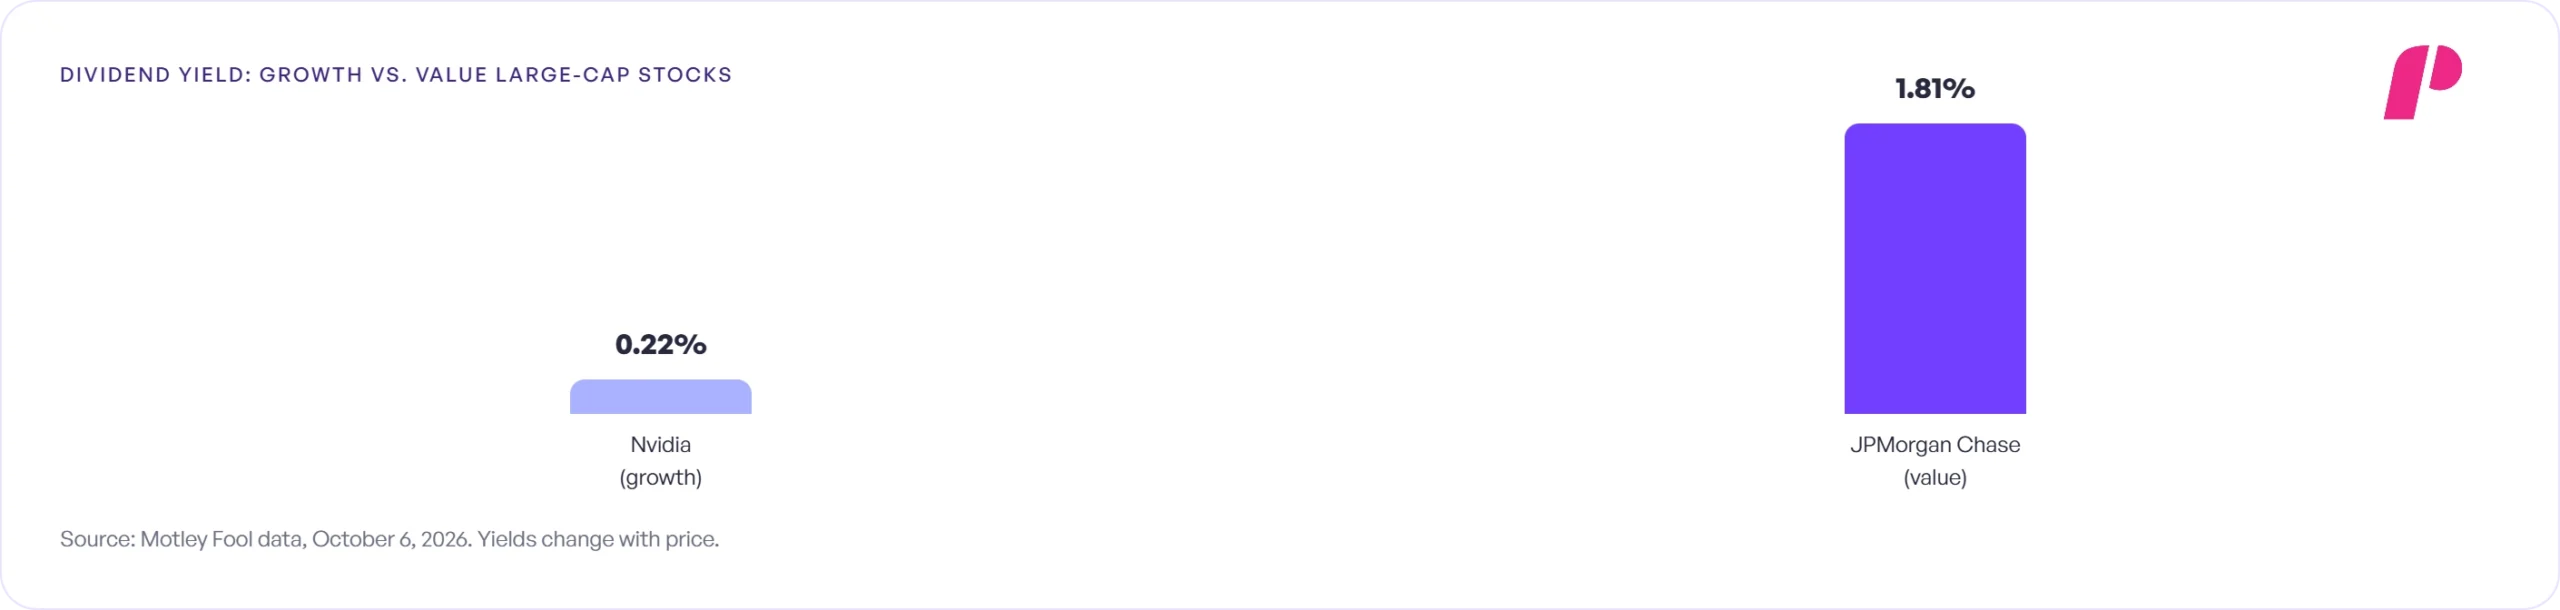
There are many such stocks, but there are also growth stocks among those that provide no dividend at all. Data provided by Motley Fool on October 6, 2026, has revealed that Nvidia gives only 0.22% while JPMorgan Chase gives 1.81% in return.
🔗 Growth Stocks vs Value Stocks
Whichever route or style a trader picks, size doesn’t remove the risk. That’s next.
Are Large-Cap Stocks Safe? Key Risks
Valuation And Sector Risk
Some guides call large caps the safest stocks around. However, that is for sure an exaggeration. Would investing in large-cap equities be a good idea in anticipation of a market correction? Size can mitigate some dangers, yet FINRA does not mince its words when it says that its size generalizations are “no guarantee” for any specific large-cap corporation. A giant can still be overpriced, or sink with its sector.
Concentration Risk And The Magnificent 7
Then there’s concentration. What is concentration risk in the S&P 500, and why has it increased? This is because this index weights the stocks according to their size.
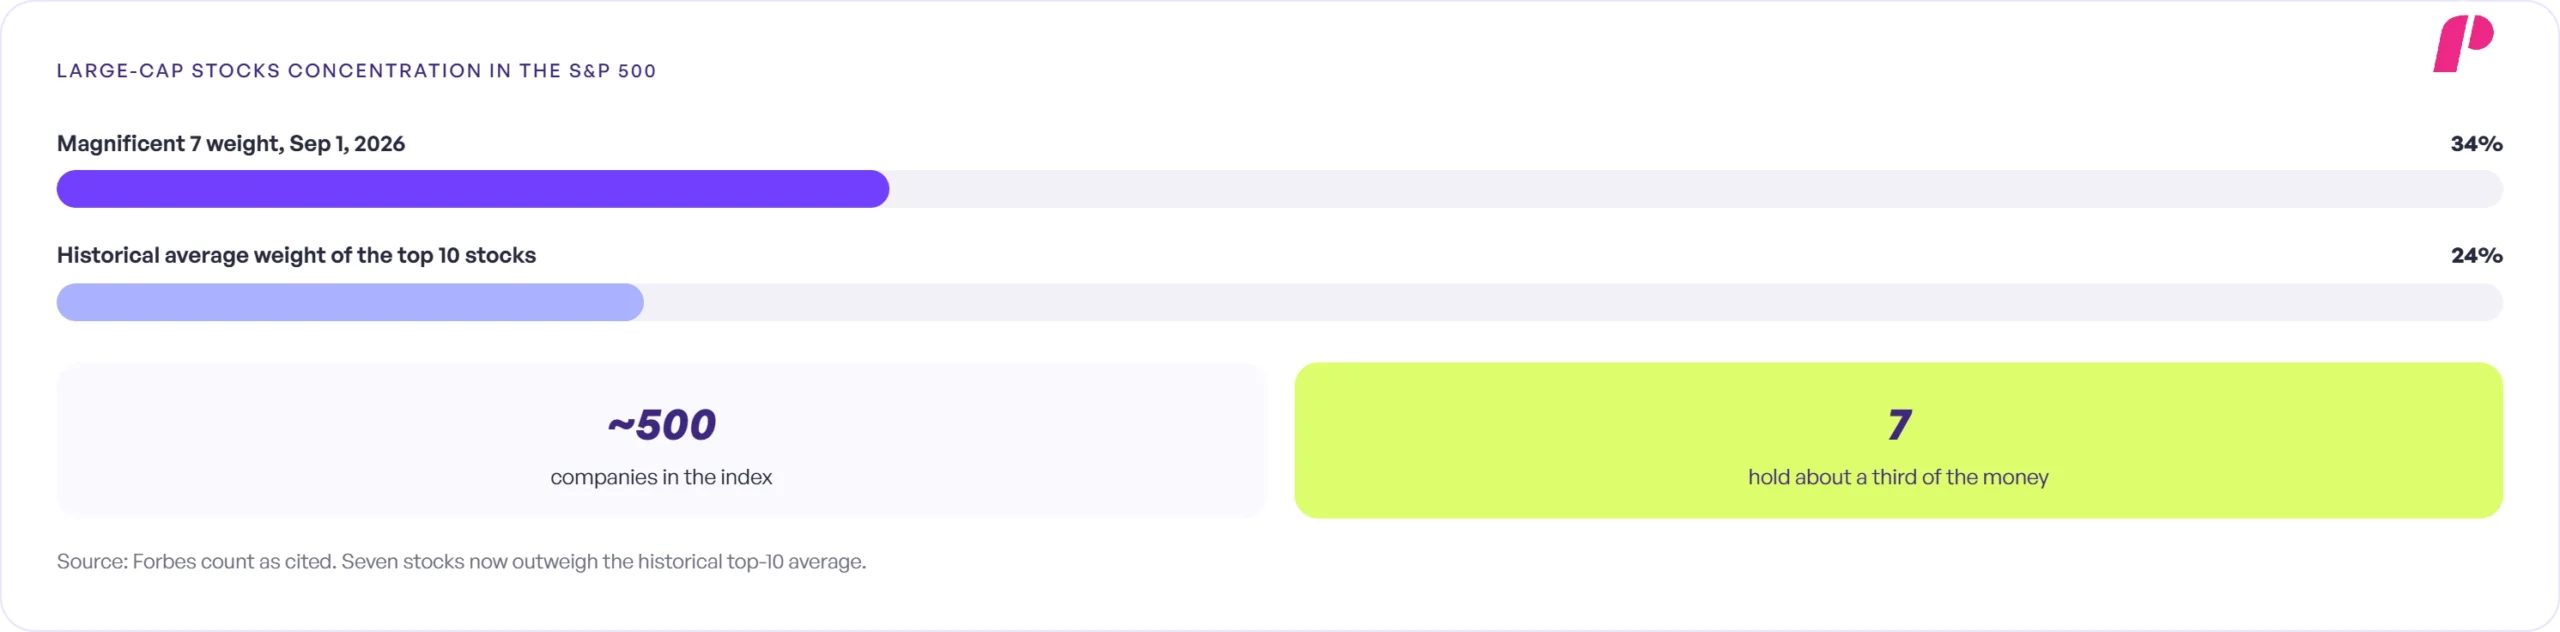
Consequently, as of September 1, 2026, in the count by Forbes, the Magnificent 7 comprised 34% of the S&P 500. Historically speaking, however, the top 10 stocks average out to 24%.
Is An S&P 500 Fund Fully Diversified?
Is an S&P 500 index fund fully diversified? On paper, it holds about 500 companies. In practice, roughly a third of the money sits in seven of them, so a bad quarter for big tech can pull the whole fund down.
Anyone holding an S&P 500 fund next to individual tech stocks may own more of the same companies than they realize.
Trading Large-Cap Stocks In A Funded Account
Liquidity And The Bid-Ask Spread
For a funded stock trader, the most useful thing about large caps is how easily they trade. Why are large-cap stocks more liquid? Basically, there are buyers and sellers in them all session long.
That usually means a tight bid-ask spread and cleaner fills, which matters when every entry and exit counts against a fixed loss limit.
🔗 What Is a Bid-Ask Spread?
Earnings Reports And Large-Cap Stocks
Large firms disclose their earnings dates far ahead of time too, and an entire crowd of analysts analyzes each one of them. So, how do large-cap stocks react to earnings reports? The move can still be big.
The difference is that the date is public, so a trader can cut size or stay flat going into it instead of walking into it unprepared.
🔗 How to Read an Earnings Report
A Four-Step Large-Cap Pre-Trade Checklist
Still, some active traders skip large caps entirely and go after thinner stocks that seem to move faster. Are large-cap stocks too slow for active trading? Indeed, they often move less in percentage terms.
But the deep liquidity is the point: tight spreads and reliable fills make it easier to stay inside a funded account’s drawdown rules.
🔗 How to Trade Small Cap Stocks
Large-Cap Stocks For Day Trading: Four Pre-Trade Checks
| Pre-Trade Check | What To Look For / Evaluation Focus | Why It Matters / Strategic Rationale |
|---|---|---|
| Size and Index Qualification | Market capitalization, index classification, and rank date | Confirms correct category label and index eligibility |
| Market Liquidity | Average daily trading volume and bid-ask spread | Ensures cleaner order fills and minimizes market impact |
| Earnings Calendar Date | Upcoming earnings report schedule | Plans and manages binary earnings gap risk |
| Portfolio Exposure | Overlap with existing open trades and sector concentration | Avoids over-exposure to a single crowded market theme |
Exact Risk Rules are on the Program Terms Page.
- Look up the market cap, which index the stock sits in, and how old that number is
- Check average volume and the bid-ask spread before getting in
- Find the next earnings date and size down if a gap is possible
- Add up exposure to the same sector across all open trades.
🔗 What Is a Funded Stock Account?
What Traders Should Remember About Large-Cap Stocks
There are certain benefits associated with large-cap stocks, such as high liquidity and thorough analyst coverage. Nevertheless, the classification of companies as large-cap may be different from one list to another.
FINRA, FTSE Russell, and S&P don’t agree on where the line goes, so any large-cap label should come with its source attached. Furthermore, being big doesn’t make a stock safe. In fact, only seven companies hold one-third of the total S&P 500 market cap.
On the other hand, small-cap stocks have been able to beat the index for some time now, until July 2026. Both these factors provide strong justification for disregarding the classification before determining the size of the position.
The process of ascertaining the size of the trade, liquidity, and risk exposure of the trade before the trade is executed takes no more than two minutes.
In addition, it easily merges into the art of charting and analyzing risks. Eventually, time will turn this abstract idea into a solid figure.
If you liked this post make sure to share it!