Traders are constantly scanning for the best options to invest or trade, especially within the prop trading space, where volatility is king, and while the choices are vast, one of the most potent vehicles remains the small-cap stock. You might wonder, what are small-cap stocks? Simply put, they are shares of publicly traded companies with a market capitalization typically ranging from $250 million to $2 billion, occupying a unique and often misunderstood corner of the US equity market. These companies sit below the radar of major institutional funds, yet they consistently attract active traders looking for faster price movement and early-stage growth exposure.
In today’s market cycle, understanding small caps is not optional. Institutional rotation, Federal Reserve policy shifts, and sector-level capital flows all create conditions where smaller companies move first. The Russell 2000 index, the primary benchmark for US small-cap equities, has become a critical signal for traders assessing broad market health. When the Russell 2000 diverges from the S&P 500, experienced traders notice. That divergence often tells a clearer story about risk appetite than headline indices alone. Small-cap stocks are not simply smaller versions of large-cap names. They operate under different structural conditions, attract different investors, and respond to macro forces in distinctly different ways.
This guide explains the mechanics of market capitalization, the construction of the Russell 2000, how interest rate cycles affect smaller companies, and which sectors currently attract the most rotation in 2026. Every section is built to give traders the market structure context they need before entering positions in this segment.
In This Guide, You Will Learn
-
- How small caps are defined and where micro caps end
- How small caps differ from mid- and large-cap stocks
- Why small-cap stocks move faster and create intraday opportunities
- Why active traders monitor the Russell 2000 every session
- How Federal Reserve rate decisions impact small-cap balance sheets
- Which sectors are leading small-cap rotation into mid-2026
What Are Small Cap Stocks?
Market capitalization is the most fundamental classification tool in the US equity markets. It is calculated by multiplying the current share price by the total number of shares outstanding. This single figure determines whether a company is classified as a micro cap, small cap, mid cap, large cap, or mega cap. That classification shapes how institutions allocate capital and how traders approach risk.
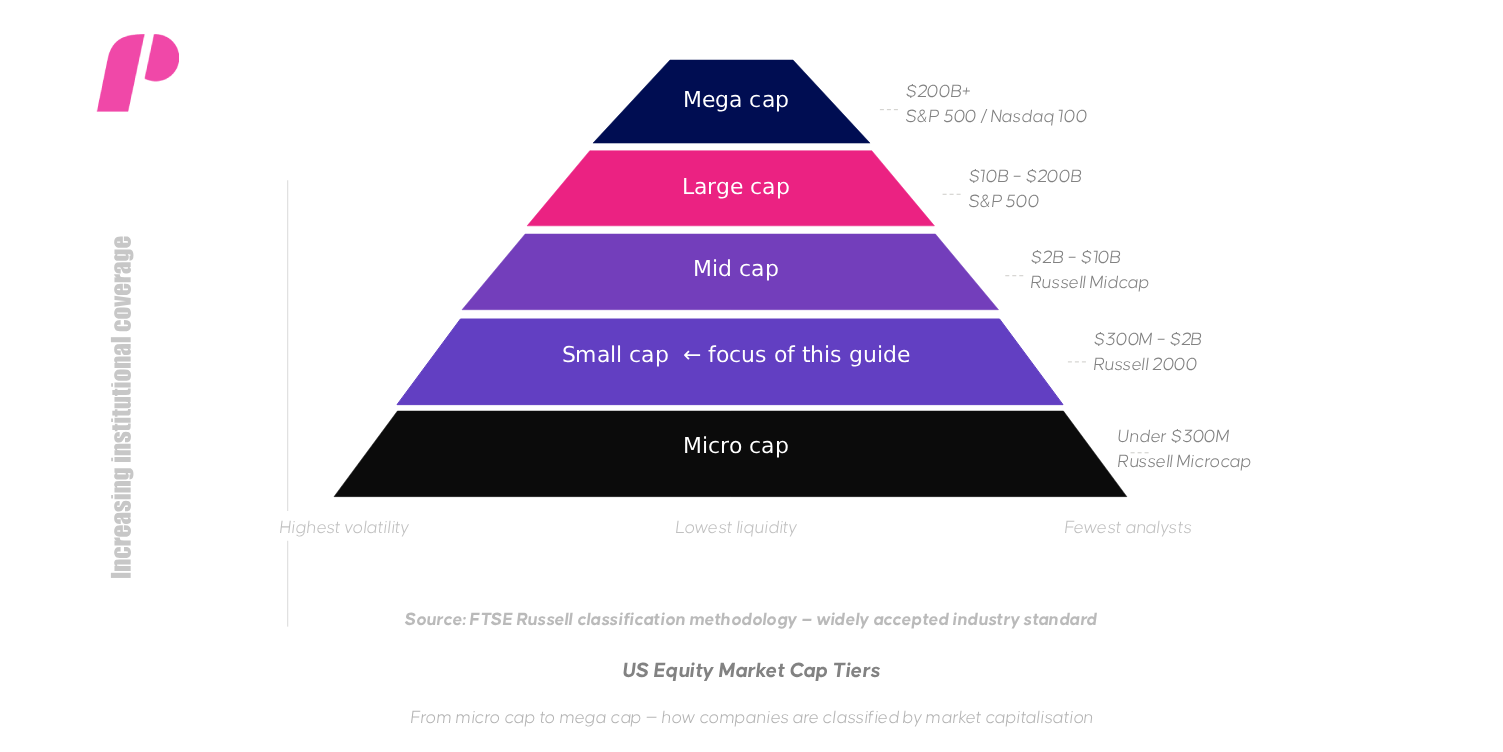
Small-cap stocks are generally defined as companies with a market capitalization between $300 million and $2 billion. This range places them above micro caps, which typically fall below $300 million, and below mid caps, which begin around $2 billion. In practice, different data providers apply slightly different thresholds. However, the $300 million to $2 billion range serves as the widely accepted standard across institutional research and index providers, including FTSE Russell. Understanding what is considered a small-cap stock begins with this market cap range.
When traders ask what small-cap means, the answer is structural. Small cap does not simply describe a small company. It describes a company at a specific stage of market development. These companies are growing, they face higher capital costs than large peers, and their share prices often reflect expectations about future earnings rather than current profitability. For active traders, the key insight is that the structural conditions around small caps create consistent patterns in price behavior.
Market Structure: Capitalization Tiers & Institutional Presence
| Category | Market Cap Range | Typical Index | Institutional Focus | Analyst Coverage |
|---|---|---|---|---|
| Micro Cap | Under $300M | Russell Microcap | Very Low | Minimal |
| Small Cap | $300M – $2B | Russell 2000 | Low–Moderate | Limited |
| Mid Cap | $2B – $10B | Russell Midcap | Moderate | Moderate |
| Large Cap | $10B – $200B+ | S&P 500 | High | Extensive |
| Mega Cap | $200B+ | S&P 500 / Nasdaq 100 | Dominant | Extensive |
Micro Cap vs Small Cap: Where the Line Falls
Traders frequently ask what microcap stocks are and how they differ from small caps. Microcap companies carry market capitalizations below $300 million. They often trade with very thin daily volume and may lack the regulatory reporting depth of larger companies. What are microcap stocks in practical terms? They represent the highest-risk, highest-volatility tier in listed equity markets.
Many microcap names exhibit behavior associated with penny stocks — erratic price swings driven by speculative interest rather than earnings fundamentals. In contrast, small-cap companies generally have established revenue bases, operating histories, and more predictable volume patterns. The transition from microcap to small cap represents a meaningful shift in market structure quality. Traders who understand this distinction can apply fundamentally different frameworks when analyzing names in each tier.
Small Caps Vs Mid Caps Vs Large Caps
Understanding what is small cap and mid cap requires more than comparing numbers on a chart. Each tier carries distinct structural characteristics that directly affect how a stock trades. Large cap stocks benefit from deep institutional ownership, extensive sell-side analyst coverage, and global investor participation. These factors create tight bid-ask spreads and consistent intraday volume profiles.
Small cap stocks operate under very different conditions. Analyst coverage is sparse. Many small-cap names have only two to five analysts publishing formal research. Institutional ownership is limited because large fund managers face liquidity constraints — buying a meaningful position in a small-cap can itself move the market. This structural gap between large caps and small caps creates both the risk and the opportunity that active traders seek. Volatility is not a flaw in small-cap stocks. It is a feature of the structural environment they operate in.
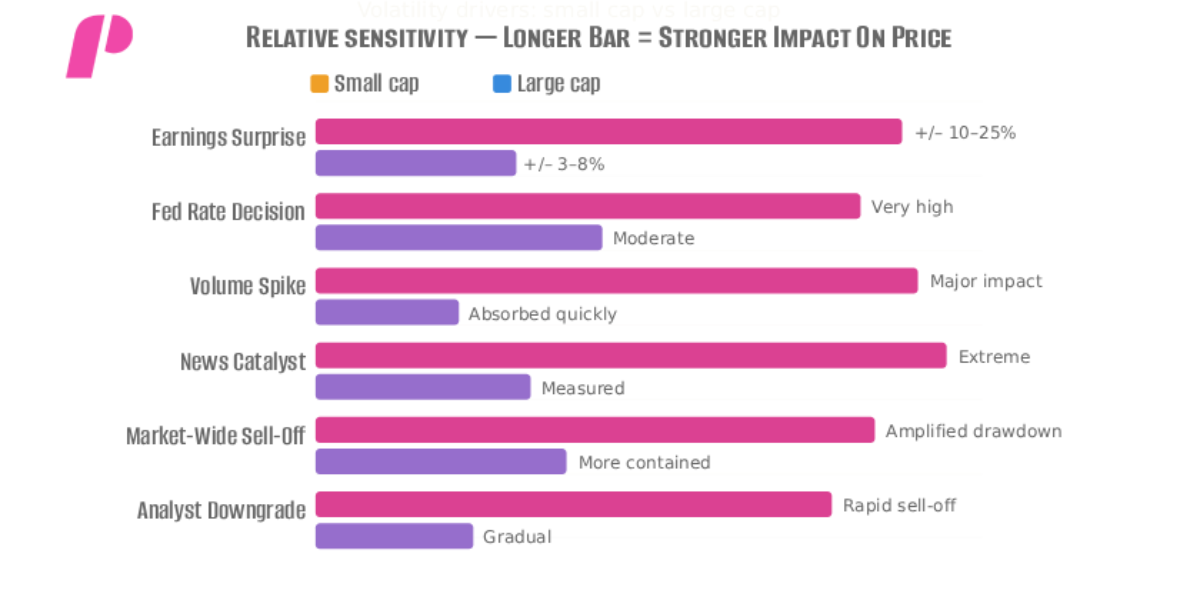
Volatility Analysis: Impact Variance by Capitalization Tier
| Volatility Driver | Small Cap Impact | Large Cap Impact |
|---|---|---|
| Earnings Surprise | +/– 10–25% | +/– 3–8% |
| Fed Rate Decision | Very High | Moderate |
| Volume Spike | Major Price Impact | Absorbed Quickly |
| News Catalyst | Extreme Reaction | Measured Reaction |
| Market-Wide Sell-Off | Amplified Drawdown | More Contained |
When traders ask which is better, mid-cap or small-cap, the answer depends on the objective. Mid-caps often represent the best risk-adjusted balance for medium-term investors. They carry more stability than small caps but retain enough growth potential to outperform large caps during expansion cycles. For active traders running short timeframes, small caps provide the intraday range that mid caps typically cannot. For long-term investors, both small and mid-cap allocations should be considered within a diversified portfolio, not as either-or decisions.
Small cap stocks rarely pay dividends. Companies in this tier typically reinvest available cash into operations, research, and market expansion. Therefore, traders focused on dividend income should look to mid and large-cap names. For those asking, do small caps pay dividends? The answer is occasionally, but it is not a primary characteristic of this market segment.
Why Small Cap Stocks Are More Volatile
Volatility in small cap stocks is not random. It follows directly from the structural conditions that define this tier. A smaller share float means that a relatively small number of buy or sell orders can meaningfully shift the price. When a large order enters a thinly traded market, the price responds quickly — far more quickly than it would in a large cap name with millions of daily shares changing hands.
Lower institutional participation amplifies this dynamic. In large-cap stocks, institutional fund managers act as a stabilizing counterforce. When prices drop, pension funds and asset managers often buy. This creates structural support. In small-cap stocks, there are fewer institutional participants, so the natural demand support at lower prices is weaker. This is why small-cap stocks react faster to news and macroeconomic announcements than large caps do. Furthermore, earnings surprises — positive or negative — can generate price moves that dwarf anything seen in the S&P 500 universe.
Volatility Drivers — Summary:
- A smaller share float creates a price impact from relatively small order sizes
- Lower daily trading volume means liquidity dries up faster during sell-offs
- Reduced institutional participation removes natural price stabilization
- Sparse analyst coverage means new information is priced in rapidly and unevenly
- Sensitivity to company-specific news events is structurally higher than in large caps
- Macro signals — especially rate announcements — produce exaggerated reactions in small caps
Volatility Drivers: Small Cap Vs Large Cap
| Volatility Driver | Small Cap Impact | Large Cap Impact |
|---|---|---|
| Earnings Surprise | +/– 10–25% | +/– 3–8% |
| Fed Rate Decision | Very High | Moderate |
| Volume Spike | Major Price Impact | Absorbed Quickly |
| News Catalyst | Extreme Reaction | Measured Reaction |
| Market-Wide Sell-Off | Amplified Drawdown | More Contained |
Active traders in programs designed around small-cap equities are drawn to these stocks precisely because of volatility. Why are small-cap stocks risky? The same forces that create intraday opportunity also create drawdown risk. A stock that moves 8% in your direction on a strong catalyst can move 8% against you on a weak one. Risk management discipline is not optional in this segment. It is the defining variable between consistently profitable traders and those who fail to survive the volatility.
Traders who understand these volatility drivers can use them constructively. However, those who ask whether beginners invest in small caps should consider that the volatility profile demands a clear trading plan, defined stop levels, and deep familiarity with position sizing. Best stocks for beginners are typically names with higher liquidity and more predictable price behavior. Small caps are best approached after foundational trading skills are in place.
Shorting Small Cap Stocks
Volatility in small cap stocks does not only create opportunity on the long side. Active traders also use short positions in small-cap names to profit from declining prices, sector weakness, or broad market sell-offs. Because small caps move faster and further than large caps in both directions, short positions can generate significant returns in compressed timeframes — but they carry proportionally amplified risk.
The mechanics of shorting a small-cap stock involve borrowing shares from a broker, selling them at the current market price, and repurchasing them later at a lower price to close the position. The difference between the sale price and the repurchase price represents the profit, minus borrowing costs and any dividends paid while the short is open. For small-cap names, the cost to borrow shares is often higher than for large caps because the supply of lendable shares is structurally limited. Thin float means fewer shares are available to borrow, which drives up the borrow rate and occasionally creates short-squeeze conditions.
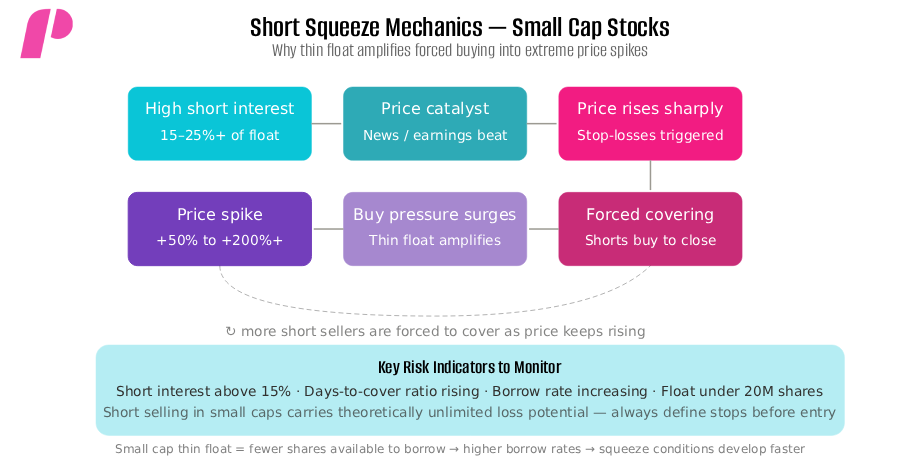
Short Squeezes in Small Caps
A short squeeze occurs when a heavily shorted stock begins to rise sharply, forcing short sellers to buy back shares to cover their positions. This buying pressure accelerates the price move upward, triggering further covering. Small cap stocks are particularly vulnerable to short squeezes because their thin float means a relatively small amount of forced buying can produce extreme price spikes. Traders who are short a small cap must monitor short interest data, days-to-cover ratios, and borrow availability closely to manage this risk.
When Traders Short Small Caps
Short selling in the small-cap space is most effective when specific structural conditions align. These include deteriorating fundamentals at the company level, sector-wide capital outflows, tightening financial conditions that pressure debt-heavy small caps, or broader market risk-off episodes where the Russell 2000 leads the decline. Interest rate tightening cycles historically create some of the most reliable short setups in small-cap equities. When the Federal Reserve raises rates aggressively, smaller companies carrying floating-rate debt face rising borrowing costs. This compresses margins, reduces free cash flow, and weakens forward earnings estimates — creating a deteriorating fundamental backdrop that supports short positioning.
Traders who short small caps during rate-tightening cycles focus on companies with high debt loads relative to earnings, minimal cash reserves, and limited ability to pass cost increases on to customers. The Russell 2000 tends to underperform the S&P 500 consistently during aggressive tightening cycles, making index-level short exposure through IWM puts or inverse ETFs a structured alternative to individual stock shorts. This approach avoids the specific short squeeze risk of individual names while still capturing the broad small-cap downside.
Key Short Setup Conditions in Small Caps:
- Rising interest rates are compressing margins on debt-heavy small-cap balance sheets
- Short interest above 15% to 25%of float — potential squeeze risk increases significantly
- Days-to-cover ratio rising — signals growing difficulty for shorts to exit positions
- Sector outflows confirmed by ETF redemption data and fund flow reports
- The Russell 2000 is breaking below key support, while the S&P 500 remains stable
- Deteriorating earnings revisions at the individual company or sector level
Risk Note: Short selling in small cap stocks carries unlimited theoretical loss potential. A shorted stock can rise 50%, 100%, or more — particularly in names with high short interest and thin float. Position sizing, defined stop levels, and borrow monitoring are non-negotiable disciplines for any trader operating short positions in this segment.
The Russell 2000 Index Explained
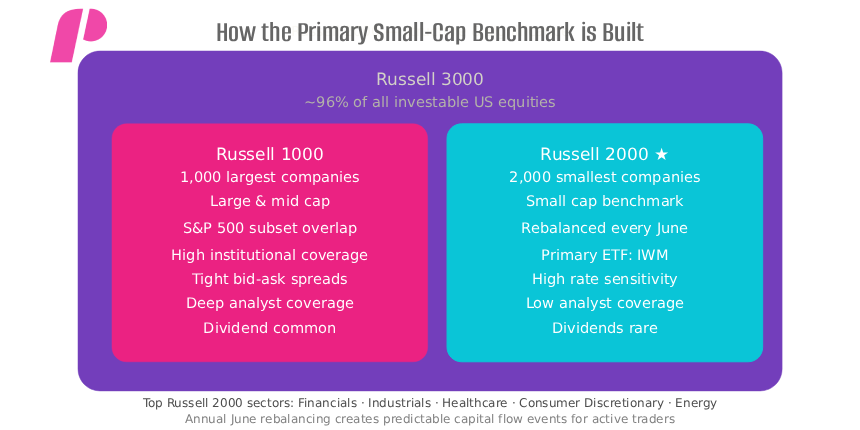
The Russell 2000 is the most widely tracked benchmark for US small cap stocks. It is maintained by FTSE Russell and includes the 2,000 smallest companies within the broader Russell 3000 index. The Russell 3000 captures approximately 96% of all investable US equities, making the Russell 2000 a genuine representation of small-cap market behavior — not a curated selection. Every active trader monitoring market structure should understand how this index is built and how it behaves.
The index is rebalanced annually, typically in late June. During the rebalancing period, significant capital flows move in and out of small-cap names as stocks cross the market cap thresholds that determine inclusion or exclusion. This annual rebalancing event creates predictable short-term trading opportunities that experienced traders monitor closely. Stocks added to the index attract buying from passive ETF managers who track the benchmark. Stocks removed face selling pressure for the same reason.
Index Comparison: Russell 2000, S&P 500, Nasdaq 100
| Feature | Russell 2000 (Small Cap) | S&P 500 (Large Cap) | Nasdaq 100 (Tech/Growth) |
|---|---|---|---|
| Cap Focus | Small Cap | Large Cap | Mega / Large Cap Tech |
| Rate Sensitivity | Very High | Moderate | High (Growth) |
| Dominant Sectors | Financials, Industrials | Tech, Healthcare | Tech, Cons. Disc. |
| Primary ETF | IWM | SPY | QQQ |
| Use for Traders | Risk Appetite Signal | Broad Benchmark | Momentum / Tech Play |
Traders frequently use the Russell 2000 as a risk-appetite indicator. When the Russell 2000 outperforms the S&P 500, it often signals that investors are rotating into higher-risk, domestically focused names. This signals confidence in the US economic cycle. When the Russell 2000 underperforms, it can signal that risk appetite is falling — often a precursor to broader market weakness. Therefore, monitoring the small cap index is not just about trading small caps. It informs broader positioning decisions across the entire portfolio.
Key Insight: The Russell 2000 divergence from the S&P 500 is one of the most reliable leading indicators of sector rotation. When small caps lead, early-cycle expansion is typically underway. When they lag, caution is warranted across risk assets.
Small Cap Stocks And Interest Rates
Interest rate sensitivity is one of the most important structural characteristics of small cap stocks. Smaller companies typically carry higher proportions of floating-rate debt than large-cap peers. When the Federal Reserve raises interest rates, the borrowing costs of small-cap companies rise faster and more directly than those of large-cap companies. This compresses margins, reduces free cash flow, and creates pressure on forward earnings estimates.
Furthermore, small cap companies rarely enjoy the same access to capital markets as large cap peers. A mega-cap company can issue corporate bonds at tight spreads due to its credit rating and global investor base. A small-cap industrial or financial company does not have that luxury. Higher rates create a proportionally larger funding burden for small-cap balance sheets. As a result, the Russell 2000 tends to underperform the S&P 500 in aggressive rate-tightening cycles and outperform in cutting cycles.
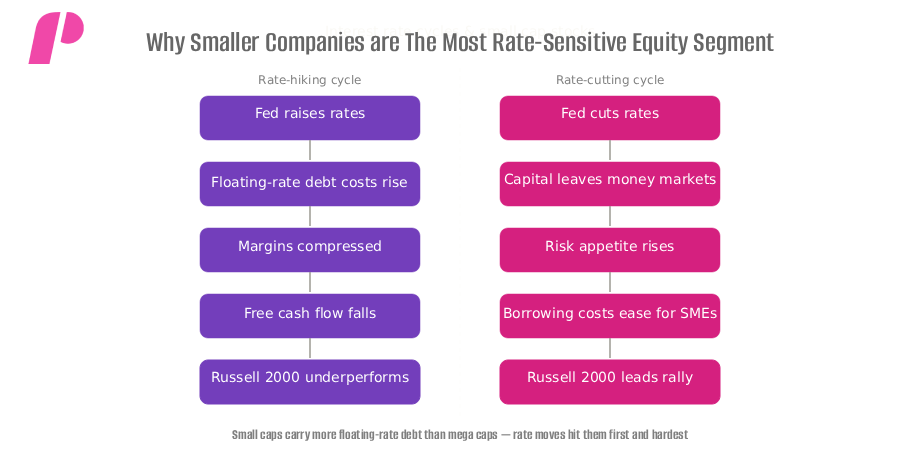
For traders interpreting Federal Reserve policy, this dynamic creates a clear framework. When the Fed signals rate cuts, small-cap stocks typically respond with accelerated buying. Capital that had been sitting in money market funds and short-duration bonds begins rotating into risk assets. Small caps, as the highest-beta segment of the equity market, often capture the first and fastest leg of that rotation. Traders who identify these inflection points early can position ahead of institutional flows.
Small Cap Stocks In 2026: Macro Rotation
The macro backdrop in 2026 has created renewed institutional interest in small-cap equities. After years of mega-cap technology dominance, institutional allocators have begun diversifying away from the narrow leadership that characterized 2023 and early 2024. Stock rotation away from mega-cap technology and into domestically exposed, cyclically sensitive small caps has become a defining theme in active portfolio management.
Small caps are historically early-cycle leaders. When a new economic expansion begins — triggered by easing monetary policy, improved credit conditions, and rising domestic consumption — smaller, domestically focused companies tend to benefit first. Large multinationals with complex global supply chains and high base valuations respond more slowly to domestic cyclical improvement. Therefore, traders who identify rotation signals early often find that small cap indices are already moving before major media headlines announce the shift.
Rotation Indicators to Monitor:
- The Russell 2000 is breaking above key resistance levels while the S&P 500 consolidates
- Declining 10-year US Treasury yields are reducing discount rate pressure on growth names
- Improving small business confidence surveys signaling broader economic strength
- Narrowing high-yield credit spreads indicates better capital access for smaller companies
- Declining US dollar reducing competitiveness concerns for domestically focused small caps
- Institutional fund flow data showing net buying in IWM and small-cap ETFs
Traders use these rotation indicators to time entries into the small-cap space rather than holding through full cycles. The question of how long you should invest in a small cap depends on your objective. Active traders use momentum signals and sector flow data to identify short-term windows. Long-term investors use valuation-based frameworks and economic cycle positioning to build multi-year exposure. Both approaches require understanding the macro forces that drive rotation in and out of this market segment.
Best Small Cap Sectors To Watch In 2026
Not all small cap stocks benefit equally during rotation cycles. Sector composition matters significantly when capital flows into the small-cap universe. In 2026, three sectors have attracted the most consistent institutional attention within the Russell 2000: Industrials, Financials, and Consumer Discretionary. Understanding why these sectors lead during early-cycle expansion helps traders prioritize their research and position selection.
Industrials
The industrial sector within the Russell 2000 includes manufacturers, logistics companies, defense contractors, and infrastructure-related businesses. When government spending accelerates — particularly in domestic infrastructure and reshoring initiatives — smaller industrial companies benefit disproportionately. These companies are often too small to receive mainstream analyst attention, yet their earnings growth during expansion phases can significantly outpace the broader market. Traders monitoring government contract awards and industrial production data will find early signals here.
Financials
Regional banks, insurance companies, and specialty finance firms dominate the financial sector within the small cap universe. These businesses are highly sensitive to the shape of the yield curve. When short-term rates fall faster than long-term rates — creating a steepening yield curve — regional bank net interest margins improve, directly boosting earnings. Furthermore, small-cap financials benefit from domestic economic strength in ways that large global banks, with their complex derivatives books and international exposure, simply do not.
Consumer Discretionary
Small cap consumer discretionary names include specialty retailers, restaurant chains, and leisure businesses. These companies depend heavily on domestic consumer spending and consumer confidence. When inflation declines and wage growth remains positive, consumer discretionary small caps often deliver earnings surprises that create significant price moves. Traders watching consumer confidence indices and retail sales data can identify early positioning opportunities in this sector before institutional consensus forms.
Small Cap Sector Rotation: Key Indicators In 2026
| Sector | Key Catalyst | Rate Sensitivity | Rotation Signal |
|---|---|---|---|
| 🏭 Industrials | Infrastructure spending, reshoring. | Moderate | PMI > 50 / Gov Contracts |
| 🏦 Financials | Yield curve steepening, credit expansion. | High | Narrowing spreads, rising NIM |
| 🛍 Cons. Disc. | Wage growth, declining inflation. | Moderate | Improving Confidence Surveys |
| 🩺 Healthcare | Drug approvals, Medicare policy. | Lower | FDA Decision Calendar |
| ⚡ Energy | Commodity prices, domestic production. | Lower | Oil Trend / Inventory Data |
Traders who ask what percentage of stocks should be small-cap stocks are essentially asking about asset allocation. Research from various asset managers suggests that a 10–20% allocation to small caps within a diversified equity portfolio provides meaningful return enhancement over full market cycles without introducing excessive concentration risk. However, for active traders running concentrated positions, the appropriate exposure is determined by volatility tolerance, account size, and time horizon rather than fixed percentages.
The question of how to know if a stock is small cap is straightforward. Market cap data is freely available through financial data providers, brokerage platforms, and exchanges. Most trading platforms display market capitalization on every stock page. A stock with a market cap between $300 million and $2 billion falls in the small-cap range. Traders should verify this figure using trailing share price multiplied by current shares outstanding — not the static market cap shown on older data sources, which may be months out of date.
Disclaimer: This article is provided for educational and informational purposes only. It does not constitute investment advice, a recommendation to buy or sell any securities, or a solicitation of any investment. All trading involves risk. Past performance is not indicative of future results. Readers should conduct their own research and consult a qualified financial advisor before making any investment decisions.
If you liked this post make sure to share it!