Applied Materials reported fiscal second-quarter 2026 results on May 14, 2026, and the print was the cleanest beat the company has delivered in over a year. Revenue of $7.91 billion set a quarterly record. Non-GAAP gross margin of 50.0% was the highest in more than 25 years. Non-GAAP EPS of $2.86 came in $0.18 above consensus, marking the fourth consecutive earnings beat. Most importantly, management raised its calendar 2026 semiconductor equipment growth outlook from “more than 20 percent”, the framing it used at the February Q1 release, to “more than 30 percent.” Furthermore, this AMAT earnings report is the moment when the AI-driven re-rating story crossed from narrative into the income statement.
The market reaction was orderly but unambiguous. Shares rose 1.6% in after-hours trading following the print and continued higher into the May 15 session, when eight Wall Street firms hiked their price targets in a single coordinated wave to a $500-$550 cluster. Bank of America noted that the July quarter guide of $8.95 billion plus or minus $500 million came in 10% to 17% ahead of consensus. Morgan Stanley raised its full-year systems growth forecast to 34% from 29%. Wells Fargo cited extended eight-quarter rolling visibility and, as a result, named Applied Materials its top semiconductor capital equipment pick.
What the AMAT Earnings Report Covers
Going into the print, AMAT stock was up 154% over the trailing twelve months and approximately 60% year-to-date, trading near $446. That backdrop made the bar unusually high. A merely good quarter would have triggered profit-taking; a strong-but-cautiously-guided quarter would have read as a cycle-top concern. What Applied Materials delivered instead was a quarter where every single operating metric reset higher, and management’s forward framing pulled the entire year-ahead expectation set up with it.
The substance of the AMAT earnings report sits in four pieces: the Q2 income statement, the Q3 guide, the structural reset on the CY2026 industry growth picture, and the EPIC Center customer ecosystem that now includes TSMC, Samsung, SK Hynix, Micron, and three founding academic partners. Each piece compounds the others.
The Headline Numbers in This AMAT Earnings Report
The Q2 income statement read as a record across multiple lines simultaneously, a configuration AMAT has not produced in recent memory. Revenue, EPS, gross margin, operating margin, and segment-level revenue for both Semiconductor Systems and Applied Global Services all hit either records or multi-year highs. The non-GAAP gross margin of 50.0% was the metric management specifically called out as the highest in over 25 years.
Financial Performance: Q2 FY2026 Performance Analysis vs. Market Consensus
| Metric (Q2 FY2026) | Consensus | Actual | YoY / Read |
|---|---|---|---|
| Revenue | $7.68B | $7.91B | Beat · +11% YoY · RECORD |
| Non-GAAP EPS | $2.68 | $2.86 | Beat +6.7% · +20% YoY |
| GAAP EPS | — | $3.51 | +33% YoY · RECORD |
| Non-GAAP Gross Margin | — | 50.0% | +80 bps · highest in 25+ yrs |
| Non-GAAP Operating Margin | — | 32.1% | +140 bps YoY |
| Semiconductor Systems Rev. | — | $5.97B | +16% seq · +10% YoY |
| Applied Global Services Rev. | — | $1.67B | +17% YoY · RECORD |
| Cash from Operations | — | $845M | FCF $210M |
| Capital Returned | — | $765M | $365M dividends + $400M buybacks |
Two Details Inside Q2 That Stand Out
Two details inside Q2 deserve particular attention. First, DRAM revenue reached $1.7 billion, up 18% year over year, a record level that management attributed to gains in wiring, patterning, and peripheral logic process steps where Applied holds a leading share. Second, Other revenue (Display and adjacent markets) of $280 million came in line with expectations; consequently, Display no longer creates drag on the overall growth picture, as it has stabilized.
Reading the Record Quarter
Three numbers anchor what is essentially the cleanest Q2 in AMAT history: revenue, EPS, and the gross margin print that broke a 25-year ceiling. Together, they describe a company that over-delivers operationally while reaping the AI capex cycle in real time.
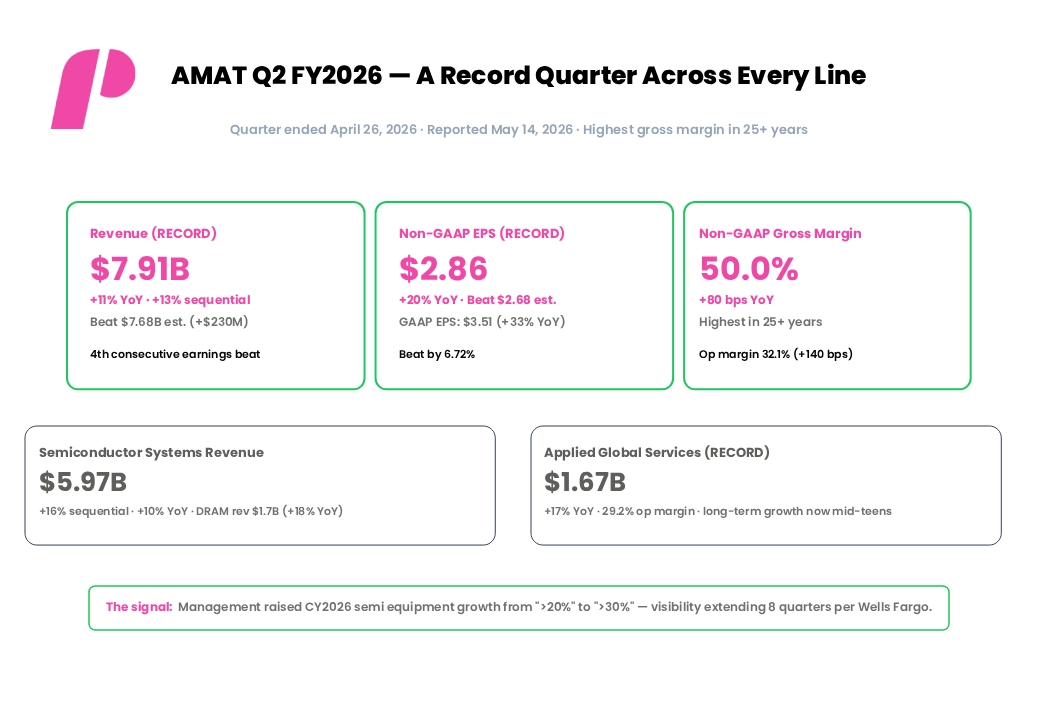
Q2 FY2026 scorecard: revenue, EPS, and gross margin all set records simultaneously.
Operating Leverage on Top of Revenue Growth
The structural read is that AMAT now captures operating leverage on top of revenue growth. Sequential revenue growth of 13% translated into a 140-basis-point expansion in non-GAAP operating margin, indicating the company converts incremental revenue dollars into earnings at a rate well above its own historical pattern. CFO Brice Hill specifically noted on the earnings call that increased build plans, inventory positions, and logistics capacity drive higher operating profit and productivity, a meaningful sign that the operating model has structural room to expand further as Q3 volumes step up.

Capital Return and the BIS Overhang
The capital return profile reinforces the message. Applied distributed $765 million to shareholders in Q2 ($365 million in dividends, $400 million in share repurchases) on free cash flow of $210 million, a payout ratio well above 100% in the quarter, sustained by the company’s substantial cash balance. The quarterly dividend rose 15% to $0.53 per share in March, marking nine consecutive years of dividend increases. Per CFO Hill, Applied has more than doubled its dividend per share over the prior four years.
What the Q2 print did not contain is also worth noting. There was no mention of the BIS settlement charge that compressed GAAP operating income by $253 million in Q1; that overhang has moved into the rearview as a one-time event. China-related concerns, which dominated commentary heading into Q1, have transitioned into a derisking story: China represented 24% of Semiconductor Systems plus AGS revenue in Q2, down from 27% the prior quarter, with management guiding the China business and worldwide ICAPS segment to be flat to slightly higher for the calendar year.
Segment Composition in the Q2 AMAT Earnings Report
Applied Materials reports across three primary segments. Semiconductor Systems captures wafer fabrication equipment sales and is by far the largest. Applied Global Services (AGS) is the recurring services and parts business attached to the installed base of tools. Other includes Display and adjacent markets. Q2 marked the first quarter where all three segments delivered year-over-year growth simultaneously, with both Semiconductor Systems and AGS hitting record revenue levels.
Segment Breakdown: Q2 Revenue Performance and Q3 Forward Outlook
| Segment | Q2 Revenue | Q2 Performance | Q3 Guide / Outlook |
|---|---|---|---|
| Semiconductor Systems | $5.97B | +16% seq · +10% YoY · 35.1% op margin | ~$6.9B Q3 · >30% CY26 growth |
| ↳ DRAM Revenue (within Semi) | $1.7B | +18% YoY · RECORD | Continued HBM acceleration |
| Applied Global Services | $1.67B | +17% YoY · RECORD · 29.2% op margin | ~$1.75B Q3 · mid-teens LT growth |
| Other (Display + adjacent) | $280M | In line with expectations | ~$300M Q3 |
| Advanced Packaging | Within Semi Systems | Accelerating | >50% CY26 growth · 3D stacking |
| China (% of Semi + AGS) | 24% | Down from 27% in Q1 | Flat to slightly higher CY26 |
AGS Re-Rating and the HBM Build-Out
Two structural shifts stand out across the segment mix. First, AGS hitting a record $1.67 billion with 17% year-over-year growth is the strongest evidence yet that the services business has structurally re-rated upward. Management explicitly raised its long-term annual AGS growth outlook from low-double-digit to mid-teens, citing rising fab utilization rates as the installed base of customer tools sees higher throughput. CY2026 AGS growth is expected to exceed that mid-teens rate.
Second, the DRAM revenue line crossing $1.7 billion in a single quarter signals that the high-bandwidth memory (HBM) build-out is showing up in AMAT’s income statement at scale. Each HBM unit requires approximately 3x the wafer area of standard DRAM and adds 19 additional manufacturing steps, 15 of which involve equipment. Moreover, AMAT captures more than 50% of the value of the tools used in those incremental steps, per CFO Hill’s commentary at the March Cantor Global Technology Conference.
The Calendar-Year Reset: What the AMAT Earnings Report Signals for CY2026
The single most consequential change in this AMAT earnings report was the upward revision to the calendar 2026 semiconductor equipment growth outlook. In February, management guided to “more than 20 percent.” On May 14, that guidance reset to “more than 30 percent”, a 50% upward revision in absolute terms. CEO Gary Dickerson described 2026 as offering “an exceptionally strong foundation for sustained, multi-year revenue and profit growth.”
The three growth vectors driving the CY2026 reset: semi equipment, advanced packaging, and AGS.
Three Growth Vectors Driving the CY2026 Revision
The reset rests on three vectors. First, semiconductor equipment industry growth at greater than 30% reflects what management hears directly from customer capex commitments: over 100 factory projects globally are under tracking, and customers increase orders as new clean-room space comes online. Morgan Stanley promptly raised its full-year systems growth forecast to 34%, up from a prior 29% estimate. Bernstein’s Stacy Rasgon called the quarter “very good” on strong equipment sales.
Advanced packaging growth of more than 50% in calendar 2026 is the second vector and arguably the most strategically important. Advanced packaging, the 3D stacking technology for assembling HBM modules and chiplet-based architectures, is where Applied has built its strongest competitive position. Investments shift toward what management calls “our leadership positions in 3D stacking,” and the company announced an agreement to acquire ASMPT’s NEXX business in Q2 to strengthen its panel-level packaging portfolio for AI accelerator applications.
The third vector is the AGS long-term growth reset. Higher fab utilizations across the industry mean customers run their installed Applied tools harder, generating higher demand for services, spares, and process optimization. The long-term annual AGS growth assumption moves from low-double-digit to mid-teens, and calendar 2026 is expected to exceed even that elevated rate.
The AI Capex Picture Behind All Three Vectors
Behind all three vectors is the AI capex picture. CFO Hill noted that cloud providers track above $600 billion in capital expenditure for 2026, and projections exceed $700 billion for 2027. Data center demand now accounts for 30% of leading-edge wafer consumption, ahead of PCs, and is on pace to overtake smartphones by 2029. Leading-edge foundry logic, DRAM, and advanced packaging together are projected to drive more than 80% of wafer fab equipment spending growth in 2026, and management expects a similar outlook for 2027.
The EPIC Center: Customer Lock-In as a Competitive Moat
Applied Materials’ Equipment and Process Innovation and Commercialization (EPIC) Center — a $5 billion R&D facility in Silicon Valley scheduled to begin operations in fall 2026 — moved from a roadmap item to a populated ecosystem in Q2. The customer commitments now include all four major memory and foundry players the AI computing buildout depends on, plus three founding academic research partners. The breadth of this commitment represents the structural moat behind the multi-year revenue and margin expansion story.
Strategic Ecosystem: Enterprise Partners, Academic Alliances, and EPIC Engagements
| Partner | Type | EPIC Engagement | Strategic Read |
|---|---|---|---|
| TSMC | Foundry | Founding partner (Announced May 14) |
Leading-edge logic + AI co-innovation |
| Samsung Electronics | Foundry + memory | Founding partner (Feb 11) |
Logic + HBM + DRAM |
| SK Hynix | Memory | Long-term DRAM/HBM collaboration | HBM leadership · materials/3D pkg |
| Micron Technology | Memory | DRAM/HBM/NAND R&D | Boise Innovation Center linked |
| Intel | IDM | 2026 EPIC Supplier Award | Tech development excellence |
| Advantest | Test equipment | Co-located Innovation Center (April) |
First testing partner |
| Synopsys + NVIDIA | EDA + AI silicon | AI + quantum chemistry materials R&D | Accelerated materials modeling |
| Stanford / ASU / RPI | Academic | Inaugural research partners | Energy-efficient AI chip R&D |
EPIC Center partner roster as of the Q2 FY2026 release.
What the Roster Means Commercially
What this roster represents commercially is multi-year co-development relationships that bind customers to Applied’s roadmap. Engineers from SK Hynix, Micron, Samsung, and TSMC work side-by-side with Applied’s R&D teams at the EPIC Center to advance materials engineering, equipment innovation, and process integration. These collaborations compress the time from early-stage research to full-scale manufacturing, which translates into earlier tool-buying commitments, deeper customer integration, and higher AMAT wallet share through each technology transition.
The Revenue Trajectory and What Q3 Says
Plotting six quarters of actuals plus the Q3 FY2026 guide makes the acceleration concrete. After holding in a $7.0-7.5 billion range through fiscal 2025, AMAT’s revenue steps up sharply: $7.91 billion in Q2 followed by a Q3 guide of $8.95 billion at the midpoint, with a plus or minus $500 million range. The Q3 midpoint implies approximately 23% year-over-year growth and another 13% sequential expansion.
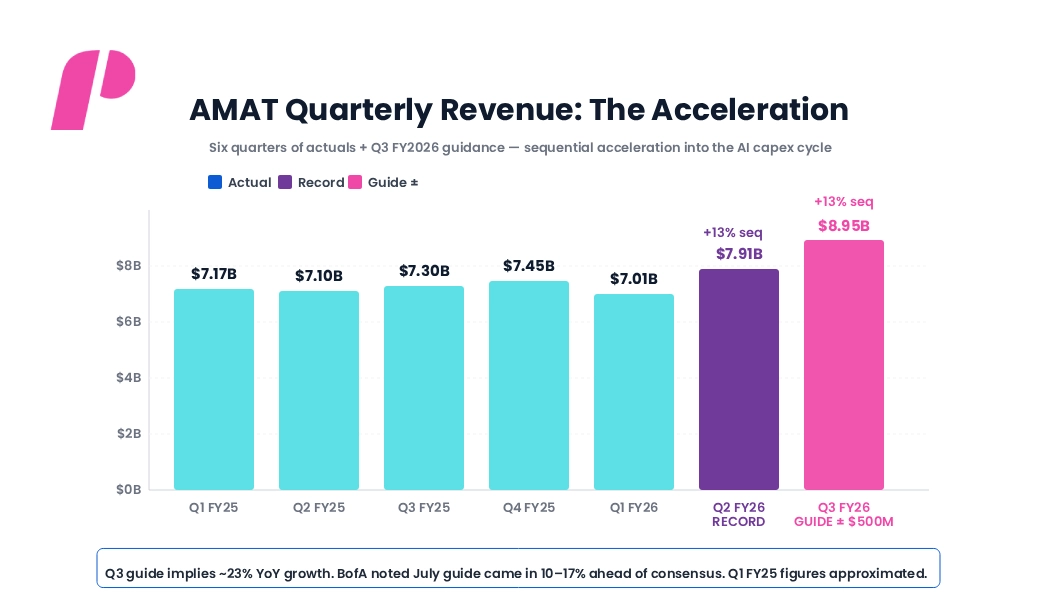
Quarterly revenue from Q1 FY2025 through Q3 FY2026 guidance (Q3 shown with ±$500M range).
Why the Upgrade Wave Was So Coordinated
The shape of this trajectory is the central reason the Wall Street upgrade wave was so coordinated. A single record quarter could be dismissed as a pull-in or favorable timing. However, a guide that meaningfully exceeds the next-quarter consensus — Bank of America noted the July quarter guide came in 10% to 17% ahead of consensus — signals the demand step-up is sustained. Wells Fargo specifically cited “extended eight quarters rolling visibility” as the basis for naming Applied its top semi-cap pick.
Q3 Segment Guidance and the Multi-Year Framing
Q3 segment guidance breaks down to approximately $6.9 billion in Semiconductor Systems revenue, $1.75 billion in AGS, and approximately $300 million in Other. Non-GAAP gross margin is expected to expand modestly to approximately 50.1%, building on the Q2 record. Non-GAAP operating expenses are guided to around $1.485 billion, and the non-GAAP tax rate is modeled at approximately 11% (incorporating an intra-entity intangible asset transfer benefit).
Beyond Q3, the framing extends into a multi-year story. Bernstein’s Stacy Rasgon noted on the earnings call that 30% year-over-year equipment growth in CY2026 implies $14.5-15 billion in second-half-of-the-calendar-year equipment revenue. In addition, CFO Hill confirmed that CY2026 remains capacity-constrained, and that 2027 could potentially be even stronger as additional clean rooms come online — a particularly bullish framing because it suggests the cycle has runway beyond the current year.
Wall Street’s Verdict on the AMAT Earnings Report: The May 15 Upgrade Wave
On May 15 — the trading day after the Q2 release — eight major firms raised their AMAT price targets simultaneously. The new targets cluster between $500 and $550, a sharp upward shift from the pre-earnings consensus and the broadest coordinated upgrade the stock has received in recent memory. Furthermore, every covering firm maintained a bullish stance; no major firm downgraded after the print.
Analyst Outlook: Institutional Ratings and Updated Price Targets
| Firm | Rating | New Target Range | Stated View |
|---|---|---|---|
| Cantor Fitzgerald | Overweight | ~$550 | Most bullish; pricing power + margin progress |
| Morgan Stanley | Overweight | $500–$550 range | Systems growth rose to 34% (from 29%) |
| Goldman Sachs | Buy | Within $500–$550 | China’s concerns about yielding to the foundry/DRAM/packaging mix |
| Wells Fargo | Overweight | Within $500–$550 | Top semi-cap pick; 8-quarter visibility |
| Bank of America | Buy | Within $500–$550 | July guide 10–17% ahead of consensus |
| Bernstein | Buy | Within $500–$550 | “Very good” quarter on strong equipment sales |
| JP Morgan | Overweight | Within $500–$550 | Capacity utilization tailwind |
Valuation Context After the Upgrade Wave
Pre-earnings, the 52-analyst median price target had been approximately $427.50. The May 15 cluster of $500-$550 represents roughly a 17-29% upward shift in target levels in a single trading day. Going into the print, the stock traded near $446 with a forward P/E of approximately 32x and forward EV/EBITDA of 27.12x — notably below comparable multiples for Lam Research (29.29x) and KLA Corporation (30.31x), despite AMAT having broader exposure across deposition, etch, thermal, inspection, and packaging.
The Risks That Can Still Break the Thesis
A record quarter does not eliminate downside scenarios. It does, however, change the risk hierarchy. Reading this AMAT earnings report against a forward risk map, the binding constraints are now valuation, supply chain execution, and the long-tail question of when the AI capex cycle peaks — not BIS compliance or China deterioration, both of which have moved into the resolved or derisking category.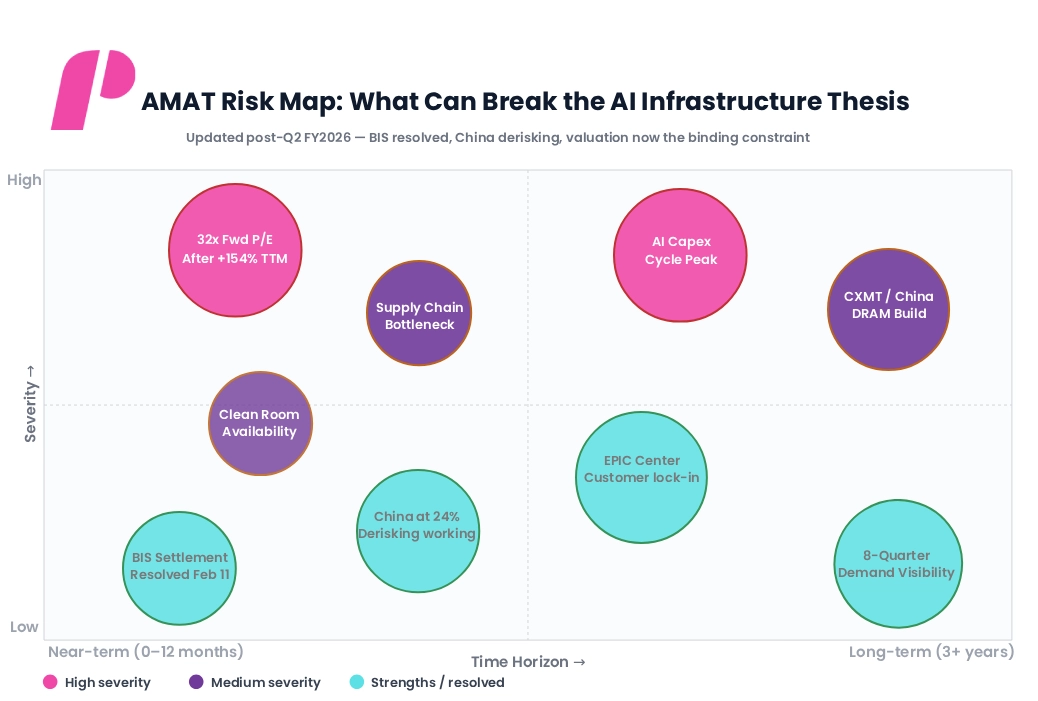
Updated risk map post-Q2: BIS resolved, China derisking, valuation now the binding constraint.
Near-Term Risk: Valuation
Near term, valuation is the binding constraint. AMAT trades at roughly 32x forward earnings after a 154% trailing-twelve-month run. The May 15 target cluster of $500-$550 implies upside in the 12-23% range from the pre-print price — meaningful, but no longer aggressive. Any disappointment on the Q3 print or guidance for fiscal Q4 (the October quarter) could trigger meaningful multiple compression simply because the stock is no longer cheaply priced relative to its own history.
Supply Chain and China Watch Items
Supply chain bottlenecks and clean room availability are the second-tier near-term risks. CFO Hill explicitly noted on the call that AMAT’s manufacturing capacity has been built out, but “fitting it up and hiring people will be necessary as we ramp up.” Customer cleanroom space is similarly constrained; the 30% CY2026 equipment growth outlook depends on customers physically having space available for new tool installs. If even a few major customers face cleanroom delays, the back-half of calendar 2026 revenue could slip into early 2027 without breaking the broader thesis.
China remains a structural watch item even as it derisks. China at 24% of Semiconductor Systems plus AGS revenue in Q2 (down from 27% the prior quarter) reflects ongoing indigenous Chinese WFE substitution by CXMT and others. Management guided China and worldwide ICAPS to be flat to slightly higher in CY2026 — a reasonable but not aggressive outlook. The risk is that Chinese DRAM build-outs continue substituting toward domestic equipment faster than expected; nevertheless, the immediate-term derisking is already substantively complete.
Long-Term Risk: The AI Capex Cycle Peak
Long term, the AI capex cycle peaking remains the unresolved question. Cloud provider capital expenditures tracking $600 billion in 2026 and projections of $700+ billion in 2027 imply continued WFE demand acceleration. However, if TSMC, Samsung, Micron, or SK Hynix were to materially reduce capital expenditure plans — for instance, in response to slowing AI inference demand or hyperscaler capex normalization — the multiple compression would be substantial. The bull case requires that AI infrastructure spending continues to grow through 2027 and beyond at the pace currently anticipated.

AMAT Earnings Reports: The Bigger Picture
Applied Materials delivered the quarter the AI re-rating story needed. Record revenue, record EPS, the highest gross margin in 25-plus years, and a Q3 guide that meaningfully exceeded consensus together build a case that the WFE upcycle is not just real — it is accelerating beyond what management itself guided to three months earlier. The 50% increase in the calendar-year semiconductor equipment growth outlook (from “>20%” to “>30%”) is the kind of revision that typically only occurs when the underlying demand picture has structurally shifted, not just improved marginally.
What Has Structurally Shifted
What has structurally shifted is the composition of WFE demand. Leading-edge foundry logic, DRAM, and advanced packaging — the three areas where Applied Materials holds the strongest competitive positions — now drive more than 80% of WFE spending growth in 2026, with a similar outlook for 2027. Data center demand now accounts for 30% of leading-edge wafer consumption. HBM, advanced packaging, and gate-all-around transistor architectures all play directly to Applied’s installed strengths. The EPIC Center, populated with TSMC, Samsung, SK Hynix, Micron, and academic partners, formalizes those competitive positions into multi-year customer commitments.
What Remains Stable Regardless of Scenario
What does not change in any scenario from here: the BIS settlement from Q1 is now in the rearview, China revenue concentration is below 25% and stabilizing, capital return continues at scale ($765 million in Q2 alone), and the dividend has now risen for nine consecutive years. The risk profile that previously combined regulatory uncertainty, geopolitical exposure, and execution risk has compressed to a more conventional cyclical equipment story, with valuation now the single biggest determinant of forward returns.
For investors, the practical takeaway from this AMAT earnings report is that the AI infrastructure capex cycle has moved from “approaching” to “in full force” — in CFO Brice Hill’s words. Applied Materials is the broadest beneficiary across the highest-growth equipment categories. The May 15 wave of $500-$550 price target upgrades reflects a market consensus that the multi-year story is intact. The remaining question is no longer whether the AI capex cycle is real, but how long it runs — and the company’s commentary on cleanroom availability suggests the answer extends into 2027 and likely beyond.
If you liked this post make sure to share it!