
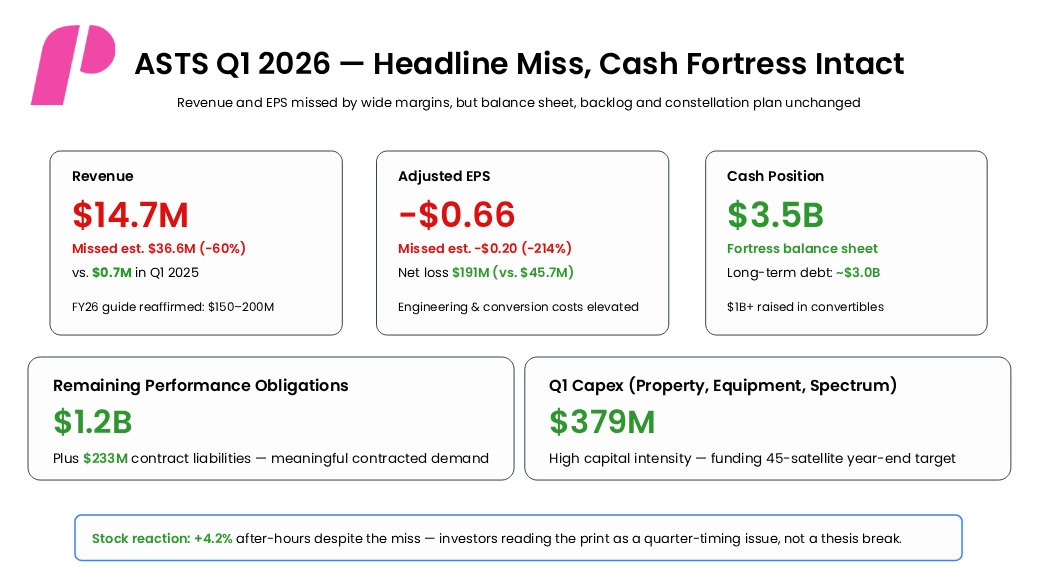
When AST SpaceMobile released its latest ASTS Earnings Report for first-quarter 2026 on May 11, the headline numbers were ugly on every comparison that matters to short-term traders. Revenue of $14.7 million came in roughly 60% below the Wall Street consensus of $36.6 million. Adjusted EPS of −$0.66 landed more than three times worse than the −$0.20 analysts were modeling. Net loss widened to $191 million, up from $45.7 million in the same quarter a year earlier.
And yet the stock rose. ASTS shares closed the regular session at $82.55 and dropped approximately -10.9% in after-hours trading. The disconnect between the print and the price tells you something important about how this name is being valued today. Investors are not buying the Q1 income statement. They are buying the constellation, the spectrum, the backlog, and the $3.5 billion cash fortress that funds the build-out. The latest ASTS earnings report is best read as a snapshot of capital intensity at its peak, not a referendum on demand.
AST SpaceMobile is building the first and only space-based cellular broadband network that connects directly to unmodified smartphones: no terrestrial cell tower, no specialized handset. The investment proposition is binary. Either the BlueBird constellation reaches commercial density and the company becomes infrastructure that competing carriers must use, or it does not. Q1 2026 was a quarter in service of that bet, not a quarter of harvesting it.
Coming into the print, the stock was up roughly +13.66% year-to-date despite a high-profile setback in April: BlueBird 7, the company’s first Block 2 satellite, was placed into an unrecoverable orbit by Blue Origin’s New Glenn-3 launch. A $155–160 million Q2 write-off is expected, partially offset by insurance. The market shrugged. The thesis depends on the cadence of the next 30+ satellites, not the loss of one.

The Headline Numbers
Q1 2026 (ended March 31, 2026) showed the company in the heart of its capital-intensity peak. Operating expenses reached $164.1 million, with $84.1 million in engineering and $43.7 million in general and administrative costs. Capex on property, equipment, and spectrum hit $379.3 million for the quarter alone (with core property and equipment additions accounting for roughly $240-260 million). The $191 million net loss included a $101.7 million ‘other non-operating expense’ line that captured induced conversion costs tied to recent convertible note issuance.
The numbers that actually matter for the bull case sit on the balance sheet and in the backlog. AST ended the quarter with approximately $3.5 billion in cash, cash equivalents, and restricted cash. Remaining performance obligations stood at $1.2 billion. Contract liabilities added another $233 million. Roughly half of the FY2026 revenue guidance is supported by the existing contracted backlog.
Earnings Snapshot: Q1 2026 Performance Analysis vs. Market Estimates
| Metric | Estimate | Actual | YoY / Read |
|---|---|---|---|
| Revenue | $36.6M | $14.7M | Missed −60% · $0.7M Q1 25 |
| Adjusted EPS | −$0.20 | −$0.66 | Missed −214% |
| Net Loss | — | $191M | vs. $45.7M prior yr |
| Cash & Equivalents | — | $3.5B | Fortress balance sheet |
| Long-Term Debt | — | ~$3.0B | Convertibles + senior debt |
| Remaining Perf. Obligations | — | $1.2B | Contracted backlog |
| FY2026 Revenue Guide | — | $150–200M | Reaffirmed |
| Q1 Capex | — | $379M | Constellation build phase |
The FY2026 revenue guide of $150–200 million is the line investors are watching most closely. That target implies a sequential ramp from $14.7 million in Q1 to roughly $40–60 million per quarter through the back half, a steep curve, but one largely driven by U.S. government milestone billing and gateway hardware deliveries to already contracted mobile network operator (MNO) partners.
Reading the Scorecard
The cleanest way to read this ASTS earnings report is to separate the income statement from the operating story. The income statement looks broken. The operating story looks intact.
 Q1 2026 scorecard: the print’s three numbers that actually matter.
Several factors compress Q1 revenue beyond what fundamentals would suggest. AST SpaceMobile’s revenue is concentrated in U.S. government milestone payments and one-time gateway hardware shipments, both of which arrive in irregular lumps tied to satellite deployment progress. With BlueBird 7 lost and BlueBird 8–10 not launched until mid-June, the timing simply did not favor the quarter.
What stayed strong is the structural picture. The MNO partner ecosystem expanded to nearly 60 operators covering more than 3 billion subscribers. The FCC authorized direct-to-device broadband service in the U.S. for up to 248 satellites, meaningfully larger than the original 100-satellite cap. AT&T, Verizon, Vodafone, and Rakuten Mobile remain anchor partners, and on May 11, management highlighted advanced ground network integration across markets covering 2.9 billion people on a combined basis.
While the market’s after-hours sell-off in the stock reflects immediate disappointment in the headline numbers, bullish investors are willing to look through one weak quarter so long as the underlying constellation cadence, regulatory clearances, and partner commitments continue to track. The latest ASTS earnings report did nothing to dislodge those long-term assumptions.
Revenue Composition and the Path to $150M
AST SpaceMobile generates revenue across two near-term streams plus a much larger long-term opportunity. The near-term streams are government services (milestone billings tied to defense and intelligence programs, including activity supporting the Golden Dome national security initiative) and gateway equipment sales (one-time hardware deliveries to MNO partners preparing their networks for SpaceMobile traffic). The long-term stream, direct-to-device commercial broadband ARPU, only activates meaningfully once constellation density crosses key thresholds.
Revenue Diversification: Q1 2026 Streams and FY2026 Outlook
| Revenue Stream | Q1 2026 | FY2026 Expected Mix | Driver |
|---|---|---|---|
| U.S. Government Milestones | The majority of Q1 | Largest single source | Golden Dome + DoD non-comms |
| Gateway Hardware Sales | Material | Lumpy, MNO-timing | MNO network integration |
| Direct-to-Device ARPU | Minimal | Ramps post-45 sats | Commercial activation |
| Commercial Pipeline | Reference data | >$1.2B disclosed | Multi-year MNO contracts |
| Total Q1 2026 | — | $14.7M actual | vs. $0.7M Q1 25 (+2,000%) |
Reaching $150–200 million in full-year revenue requires acceleration but is not a stretch given the government milestone calendar and gateway delivery schedule already disclosed. The harder question is what FY2027 looks like: that is, when the constellation should cross the 45-satellite continuous-coverage threshold and when commercial ARPU revenue is supposed to take over from milestone-driven lumpiness.
The 45-Satellite Threshold
The single most important operational milestone in 2026 is reaching approximately 45 BlueBird satellites in low Earth orbit by year-end. At that density, the company believes it can deliver continuous SpaceMobile service across the United States, Europe, Japan, and other strategic markets. Below that threshold, coverage is intermittent, and revenue stays milestone-driven. Above it, the commercial revenue model activates.
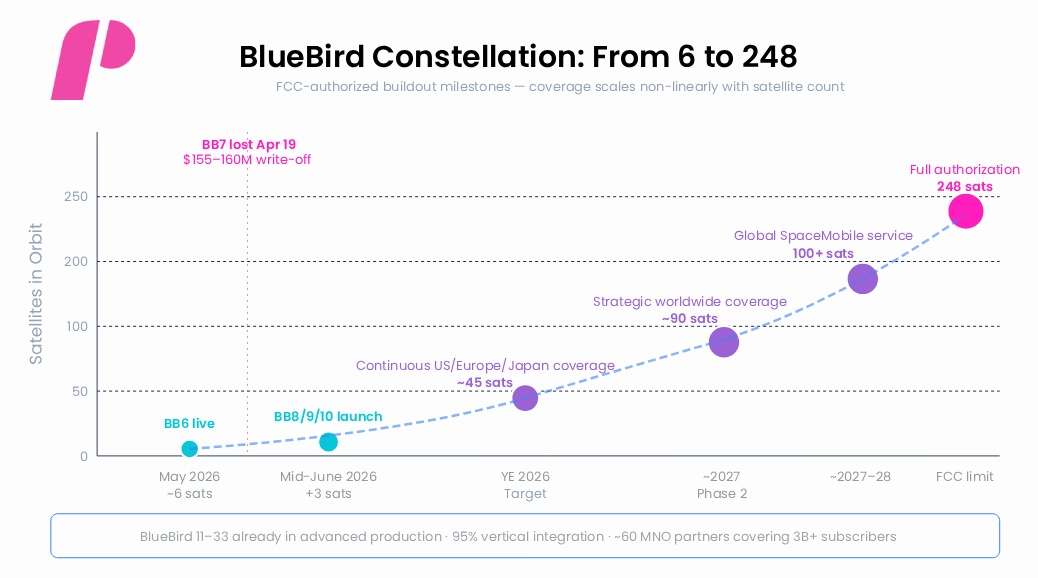
BlueBird constellation roadmap with key density thresholds and FCC authorization caps.
Today, the constellation has roughly 6 operational satellites, including the BlueBird 6 Block 2 unit. BlueBird 8, 9, and 10 are scheduled for a mid-June multi-stack launch. BlueBird 11 through BlueBird 33 are in advanced production and assembly. Management has not changed its 45-satellite year-end target despite the loss of BlueBird 7, instead absorbing that shortfall by stacking more satellites per launch.
BofA’s Michael Funk and Clear Street both flagged the math: at an average of roughly 5.5 satellites stacked per launch and a cadence of one to two launches per month, achieving 45 satellites by year-end requires near-flawless execution. Clear Street trimmed its price target from $137 to $115, specifically on launch cadence risk. The constellation step from 6 to 45 satellites in seven months is the most operationally demanding sequence in the company’s history.
Beyond 45, the longer-term targets matter less for 2026 valuation. AST SpaceMobile believes 90 satellites unlock additional strategic worldwide markets, and 100+ satellites enable continuous global SpaceMobile service. The FCC has now authorized a network of up to 248 satellites, significantly larger than originally permitted, and supporting the company’s $1.2 billion commercial pipeline that presupposes broader geographic coverage.
The Partner Ecosystem
AST SpaceMobile’s commercial moat is not the satellites alone. It is the partner ecosystem: ~60 mobile network operators with combined coverage of more than 3 billion subscribers, plus an active U.S. government customer relationship that spans national security communications and adjacent applications. The breadth of the partner roster is an asset that competing direct-to-device entrants, including SpaceX Starlink’s direct-to-cell offering, cannot quickly replicate.
Global Ecosystem: Major MNO Partnerships and Strategic Government Contracts
| Partner / Customer | Geography | Status | Strategic Value |
|---|---|---|---|
| AT&T | U.S. | Anchor MNO partner | Largest U.S. market access |
| Verizon | U.S. | Anchor MNO partner | U.S. coverage complement |
| Vodafone | Europe, Africa | Anchor MNO partner | Europe + Africa scale |
| Rakuten Mobile | Japan | Anchor MNO + investor | Japan market access |
| U.S. Government | United States | Active milestones | Golden Dome + intel apps |
| Bell, Telkomsel, Saudi Telecom, others | Global | MOUs / Definitive | Geographic breadth |
| ~60 MNOs total | Global | 3B+ subscribers | Total addressable base |
The Revenue Curve to Watch
Looking at quarterly revenue in a chart makes one thing clear: the FY2026 guide implies a step-function ramp from Q1’s $14.7 million base to a back-half cadence of $40–60+ million per quarter. The shape of that curve is the single best operational tell for whether AST is executing or slipping.
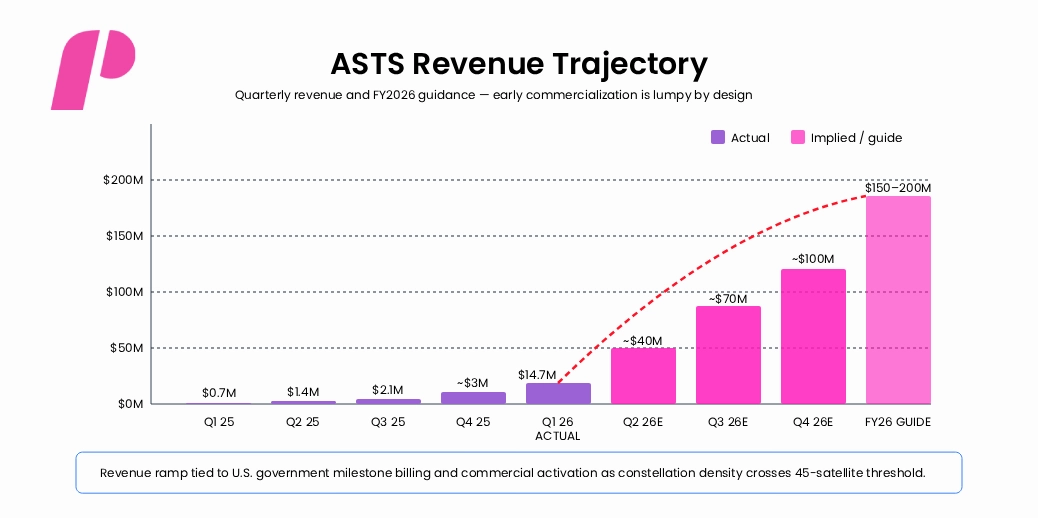
Quarterly revenue trajectory: Q1 2025 (pre-revenue) through implied FY2026 guidance.
Two important nuances frame this curve. First, AST SpaceMobile remains in the steepest part of its capital-intensity ramp. Q1 capex of $379 million dwarfed revenue by a factor of 26x. That ratio compresses dramatically once the constellation reaches commercial density and ARPU revenue begins flowing, but the curve has to bend, not just rise.
Second, the company is increasingly being valued on a 2027–2028 revenue scenario rather than current-year results. At full network deployment with ~100+ satellites, sell-side models of the addressable market vary widely, but consensus revenue projections for FY2028 are closer to $1 billion and beyond. The current ~$14B market cap is pricing meaningful execution against those out-year scenarios.
Wall Street’s Verdict
Analyst price targets on ASTS span an unusually wide range, a reflection of the binary nature of the constellation thesis. Bullish analysts see a category-defining infrastructure asset with regulatory authorization in hand. Bearish analysts see a capital-hungry development-stage company priced against revenue scenarios still several years out.
Analyst Outlook: Institutional Ratings and Price Targets
| Firm | Rating | Target | Core View |
|---|---|---|---|
| Clear Street | Buy | $115 | Cut from $137 on the launch cadence risk |
| Bank of America | Neutral | $100 | BB7 loss a ‘shock’ but thesis intact |
| MarketBeat avg. | Hold | $82.51 | Consensus across coverage |
| Public.com avg. | Hold | $72.10 | Implies modest near-term downside |
| Barclays | Equal-weight | $65 | Raised from $60 in April |
| Bear case (selected) | Sell | $41.20 | Capital intensity, dilution risk |
The spread is striking, from $41.20 on the bear end to $115 on Clear Street, and the consensus sits around $72–82, slightly below the current after-hours print. That tells you the average analyst sees the stock as fairly valued today, with bull cases requiring evidence of incremental execution in the constellation to re-rate.
The Risks That Can Break the Thesis
There is no version of this story where AST SpaceMobile is a low-risk position. The latest ASTS earnings report contained the most expensive single quarter of operating losses in the company’s history, financed by leverage that has more than doubled in 12 months. The risk picture concentrates on launch execution, competitive entry, and capital structure.
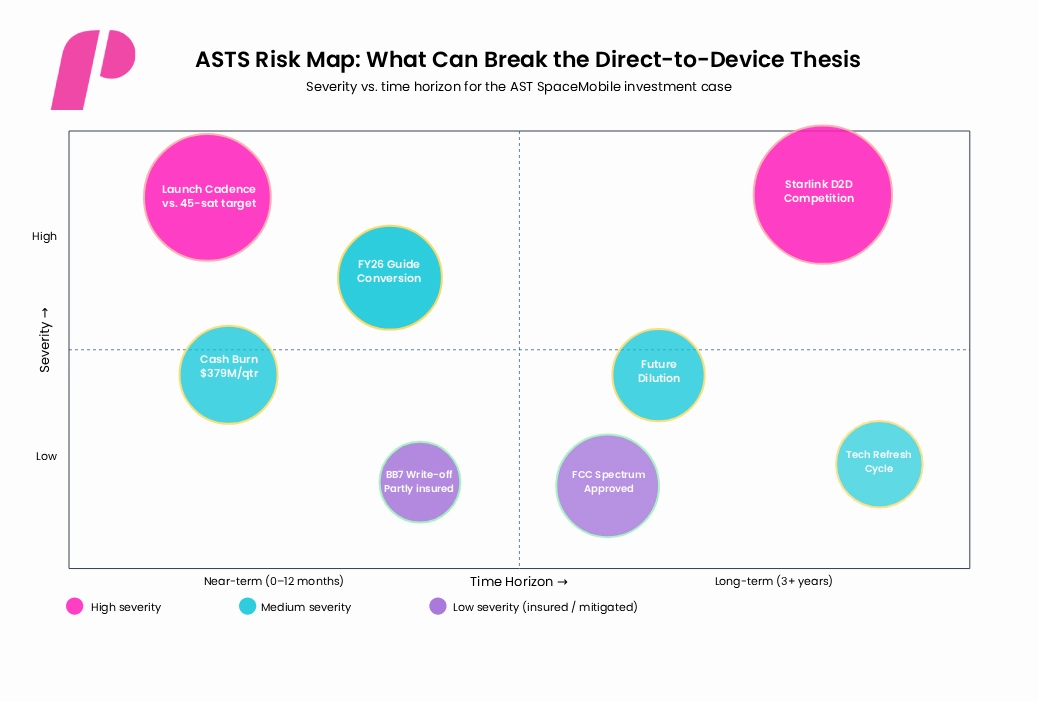
Risk severity vs. time horizon for the ASTS investment thesis.
In the near term, launch cadence is the binding constraint. To hit ~45 satellites by year-end after losing BlueBird 7, AST needs near-flawless execution from Blue Origin, ULA, and SpaceX as launch partners, and BlueBird 8–10’s mid-June deployment is the next major test. Any slippage compresses the constellation-density story underpinning commercial revenue activation in FY2027.
Long term, SpaceX’s Starlink direct-to-cell offering is the most credible competitive threat. Starlink has launch logistics, manufacturing scale, and existing constellation density that AST does not. The differentiation thesis depends on AST’s spectrum holdings, its 95% vertically integrated manufacturing model, and a patent estate of roughly 3,900 claims that should make replicating the direct-to-unmodified-handset capability legally and technically expensive.
Capital structure is the second-order concern. At a $3.5 billion cash balance offset by $3.0 billion of long-term debt, AST has runway, but its capex profile means another financing round (likely a mix of debt and equity, given recent convertible activity) is plausible before the company reaches free cash flow positivity. Dilution risk is part of the price of investing in development-stage infrastructure.
ASTS Earnings Report: The Bigger Picture
The clean read of this ASTS earnings report is that nothing about the underlying thesis changed, and several things about the operating story improved. FCC authorization expanded the addressable constellation to 248 satellites. The partner ecosystem widened. The U.S. government revenue line continued advancing through the Golden Dome and adjacent contracts. The balance sheet retained the cash needed to fund the build. The headline miss was a function of timing and one-time costs, not demand.
What did not improve is the gap between the company’s current cash burn and its ability to convert backlog into recognized revenue at scale. That gap will not close until the constellation reaches commercial density, and the bridge between Q1’s $14.7 million and the FY2026 guide of $150–200 million will be tested every quarter from here until year-end. Every subsequent ASTS earnings report between now and December is essentially a checkpoint against that ramp.
For investors, the bullish perspective remains straightforward: AST SpaceMobile is viewed as one of the cleanest pure exposures to satellite-based direct-to-device connectivity, with regulatory authorization, MNO partnerships, and, proponents argue, a defensible technology stack that competitors cannot replicate quickly. Conversely, bearish analysts maintain that it is a capital-intensive company priced against execution that has not yet happened, carrying significant dilution risk. While a single quarter does not break the long-term thesis, that thesis only holds if launches continue on schedule. The next major proof point arrives in mid-June with BlueBird 8, 9, and 10.
If you liked this post make sure to share it!