A trader opens an IPO calendar on Monday and sees a well-known company scheduled to list on Thursday. The price range looks reasonable, and the deal size suggests strong interest from large investors.
However, by Wednesday, that Thursday date is gone, and the row now shows a single word: postponed.
Nothing unusual happened, since an expected date on an IPO calendar was never a promise, only an estimate. In an uncertain environment, an underwriter would prefer to push back or scale back on the deal than to price it too low. Consequently, in making plans based on a particular date, one is essentially planning on assumptions.
How to Read an IPO Calendar Beyond the Listing Date
The columns that novice traders avoid, including shares issued and status, are those with a lot more information. “The number of stocks shows future supply, and the status column denotes confidence in the transaction.”
They convert the list of tickers into a plan. This way, after weeks of shifting dates and unexpected open dates, the frustration turns into a question.
As such, the following question becomes quite clear for most investors: “How should I use the calendar of IPOs?” The honest answer starts with the columns, because every decision depends on reading them correctly.
What This IPO Calendar Guide Covers
In this article, we will run through each field first, from the price range to the status. Then we follow one deal from its SEC filing to pricing night, so each status has context.
Moreover, it becomes necessary to allocate a separate chapter for lockup expiration, as it occurs after several months and is usually overlooked by most traders.
Lastly, it is important to take into account the funded account approach, as the volatility on the first trading day can easily hit the daily loss limit. Alongside this, calculation examples and a weekly routine make all definitions useful. However, no section promises profits, because new listings carry real risk for every type of trader.
- What an IPO calendar is and where to find one
- What each field means, including price range and deal size
- How a deal moves from S-1 filing to the first trade
- Why lockup expiry dates deserve a place on the calendar
- How funded traders plan risk around new listings
What Is an IPO Calendar?
IPO Calendar Definition
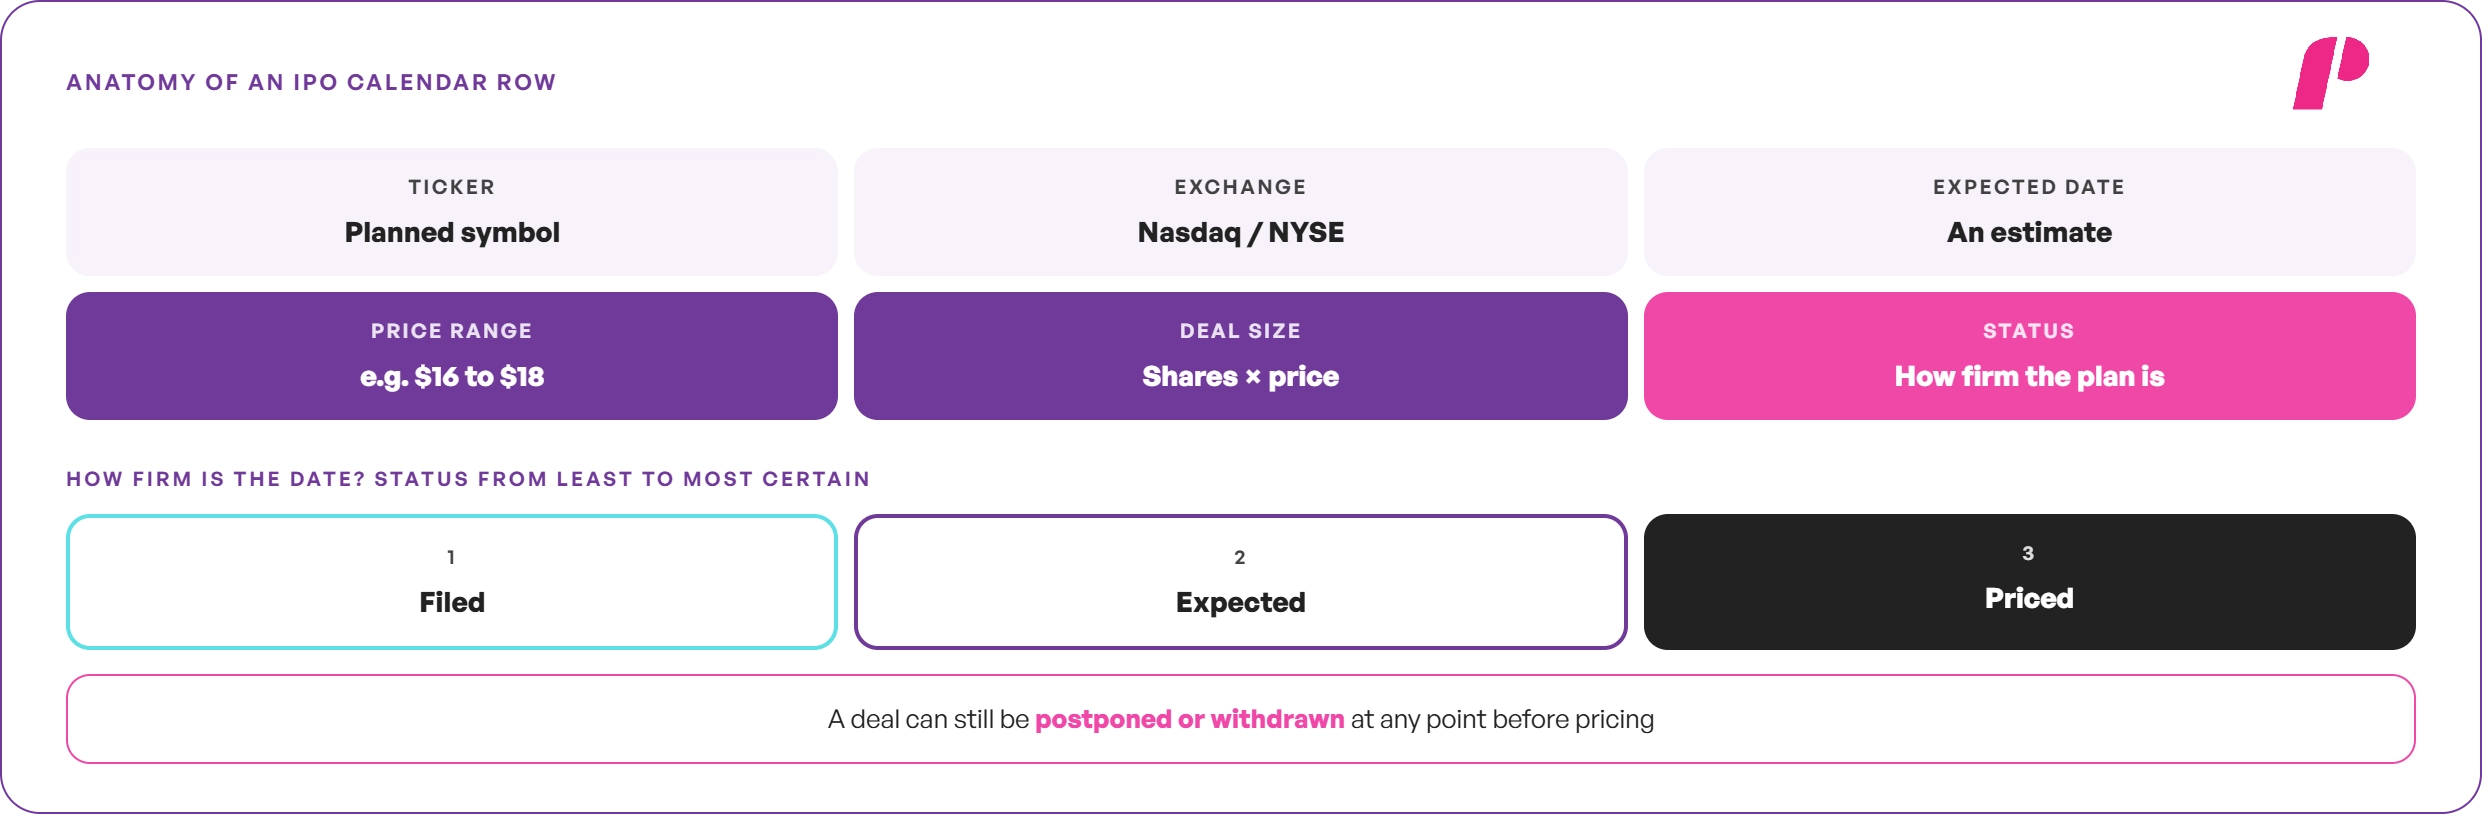
In simple terms, the IPO Calendar provides information about those companies which have decided to go public in the near future. This means that each line provides a brief summary about the deal in terms of the ticker, exchange, date, range, size, and status.
The first query that people usually type after “What is an IPO calendar?” is easier than that and concerns the abbreviation “IPO”. IPO stands for initial public offering, which is when a private company first sells its shares to the public.
🔗 IPO Explained: How Initial Public Offerings Work
Where IPO Calendar Data Comes From
Furthermore, “Where can I find an IPO calendar?” has an easy answer, and the Nasdaq IPO calendar is one. Financial data sites and most broker platforms publish free versions, and the NYSE IPO calendar offers another view.
As for “What are the upcoming IPO schedules?”, an upcoming IPO calendar changes weekly, so each field needs careful reading.
What an IPO Calendar Shows, Field by Field
Price Range and Shares Offered
Each column answers one simple question, and beginners usually misread the price and size columns first. Readers asking “What information does an IPO calendar show?” get the answer field by field in Table 1.
For example, a $16 to $18 IPO price range is the underwriters’ best guess at where demand will settle.
IPO Calendar Fields Explained
| Calendar Field | What the Field Shows | Why Traders & Analysts Care |
|---|---|---|
| Company Name & Ticker | Issuer name and planned stock exchange symbol | Instantly identifies the equity asset and links to market data feeds |
| Listing Exchange | Primary trading venue (Nasdaq, NYSE, or alternative exchange) | Determines market infrastructure, liquidity pools, and official trading hours |
| Expected Listing Date | Targeted public debut week or specific calendar day | Provides a timing estimate that frequently shifts based on market demand |
| Price Range | Anticipated initial public offering price per share | Upward or downward revisions signal institutional demand strength |
| Shares Offered | Total number of primary and secondary shares made available for sale | Drives total deal size and circulating float dynamics upon listing |
| Total Deal Size ($) | Aggregate gross proceeds (shares offered multiplied by offer price) | Measures the total capital the offering seeks to raise from public markets |
| Lead Underwriters | Investment banking syndicate managing the book building and pricing | Indicates institutional backing and controls institutional share allocation |
| Offering Status | Current lifecycle stage (Filed, Expected, Priced, or Withdrawn) | Reflects how firm the listing schedule and regulatory approval status are |
Deal Size and How to Calculate It
Furthermore, the IPO deal size follows from simple math, since it multiplies the shares offered by the offer price. For example, 10 million shares at a hypothetical $17 midpoint suggest a $170 million deal, if the range holds.
🔗 What Is Market Capitalization? Formula, Types & Meaning
Hypothetical Deal Size Example
| Calculation Input Metric | Numerical Value / Benchmark | Mathematical Formula & Calculation Method |
|---|---|---|
| Total Shares Offered | 10,000,000 shares | Extracted directly from official SEC registration calendar filings |
| Initial Price Range | $16.00 to $18.00 per share | Extracted directly from preliminary SEC prospectus (Form S-1) |
| Midpoint Offer Price | $17.00 per share | Sum of price bounds divided by two: ($16.00 + $18.00) ÷ 2 |
| Gross Deal Size at Midpoint | $170,000,000 | Shares offered multiplied by midpoint price: 10,000,000 × $17.00 |
| Gross Deal Size at Top of Range | $180,000,000 | Shares offered multiplied by maximum price: 10,000,000 × $18.00 |
| Gross Deal Size at Bottom of Range | $160,000,000 | Shares offered multiplied by minimum price: 10,000,000 × $16.00 |
These are gross proceeds before underwriting fees.
Status Labels: Filed, Expected, Priced, Withdrawn
In contrast, the status column tracks the deal’s progress, and the expected vs priced IPO split matters most. Here, many readers ask a practical question: “What is the difference between an expected and a priced IPO?” An expected IPO has a planned date and a range, while a priced IPO already has its final offer price.
How a Deal Moves From Filing to First Trade
From S-1 Filing to Set Terms
However, a deal does not reach the calendar fully formed, because it passes through several public stages first. Anyone wondering “How do I know if a company is going public?” should look out for the S-1 filing.
As for “What determines when a company goes public?”, the company must be ready, but markets often set the timing.
The IPO Cycle, Stage by Stage
| IPO Lifecycle Stage | What Happens in This Stage | What Traders & Analysts Check |
|---|---|---|
| 1. Initial Filing Stage | Company officially files Form S-1 registration statement on SEC EDGAR | Core business model, competitive advantages, and primary risk factors |
| 2. Terms Set Stage | Indicative price range and total share count are added via prospectus amendment | Initial deal size calculations and preliminary valuation multiples |
| 3. Expected Listing Stage | Public offering is scheduled for execution during a specific target week | Upward or downward amendments to pricing ranges or share volumes |
| 4. Pricing Stage | Final public offering price is locked in, typically during the evening before trading | Final offering price versus original preliminary filing range bounds |
| 5. Secondary Trading Debut | Stock officially opens for public market transactions on its primary exchange | Opening cross price versus official public offering price to gauge initial demand |
| 6. Lock-Up Expiry Stage | Insider shares become eligible for open market sale, typically 180 days post-IPO | Trading volume surges and potential downward price pressure from insider supply |
| 7. Postponed or Withdrawn | Public offering process is officially delayed, shelved, or entirely cancelled | Promptly remove the symbol from active trading watchlists and calendars |
🔗 What Is an S-1 Filing? How to Read One Before an IPO
Pricing Night
However, “What is an IPO cycle?” is basically composed of five steps: filing, terms, pricing, trading, and lockup expiry. For anyone asking “What does it mean when an IPO is priced?”, the range disappears, and one final price remains. The IPO pricing date usually falls on the evening before trading begins on the exchange.
The First Trade
However, a priced IPO rarely trades right at 9:30 a.m., because the exchange first gathers orders before the opening print. Furthermore, “How long does it take for a company to go public?” has no fixed answer, since preparation takes months.
🔗 Stock IPOs and IPO Trading
How to Read an IPO Calendar Step by Step
Build a Weekly Watchlist
Traders who want a routine read the calendar once a week, instead of reacting to every new ticker. For instance, the answer to the question “How to use an IPO calendar?” starts by listing the expected deals each Monday.
Traders start looking at the IPO calendar this week, check for status updates every day, and prepare for the opening price.
Weekly Routine for New Listings
| Workflow Day / Milestone | Primary Analytical Task & Action | Core Question to Answer |
|---|---|---|
| Monday | Open the weekly IPO calendar and compile a working list of scheduled public offerings | Which incoming deals fit active trading hours and risk parameters? |
| Tuesday to Wednesday | Monitor SEC EDGAR filings for registration status updates and pricing amendments | Did the indicative price range or share volume shift up or down? |
| Pricing Night (Evening Prior) | Record the final confirmed public offering price upon syndicate release | Did the final price print above, inside, or below the original preliminary range? |
| Listing Day (Public Debut) | Track secondary market activity and wait for the official opening exchange print | How does the opening trade price compare against the official public offer price? |
| Post-Listing (Ongoing) | Map out and calendar insider lock-up expiration dates and supply milestones | When exactly can corporate insiders and early backers begin selling shares? |
Track Status Changes Daily
Meanwhile, readers who search how to buy IPO shares before listing often ask: “Can a normal person buy an IPO?” Yes, after listing: retail traders can buy once the stock trades, but offer-price shares are harder to get.
According to the SEC, underwriters distribute most IPO shares to institutional and high-net-worth clients.
🔗 IPO Price Range vs Final Price: What Changes on Pricing Night
Plan Around the Opening Print
Therefore, anyone researching how to buy IPO stock on the first day should plan around the opening print, not the offer.
Jay Ritter’s data shows a 19.0% mean first-day return across 9,345 US IPOs from 1980 to 2025.
🔗 Position Sizing in Forex & Stocks: Calculate Trade Size and Risk
After the Listing: The Lockup Expiration Calendar
What a Lockup Agreement Is
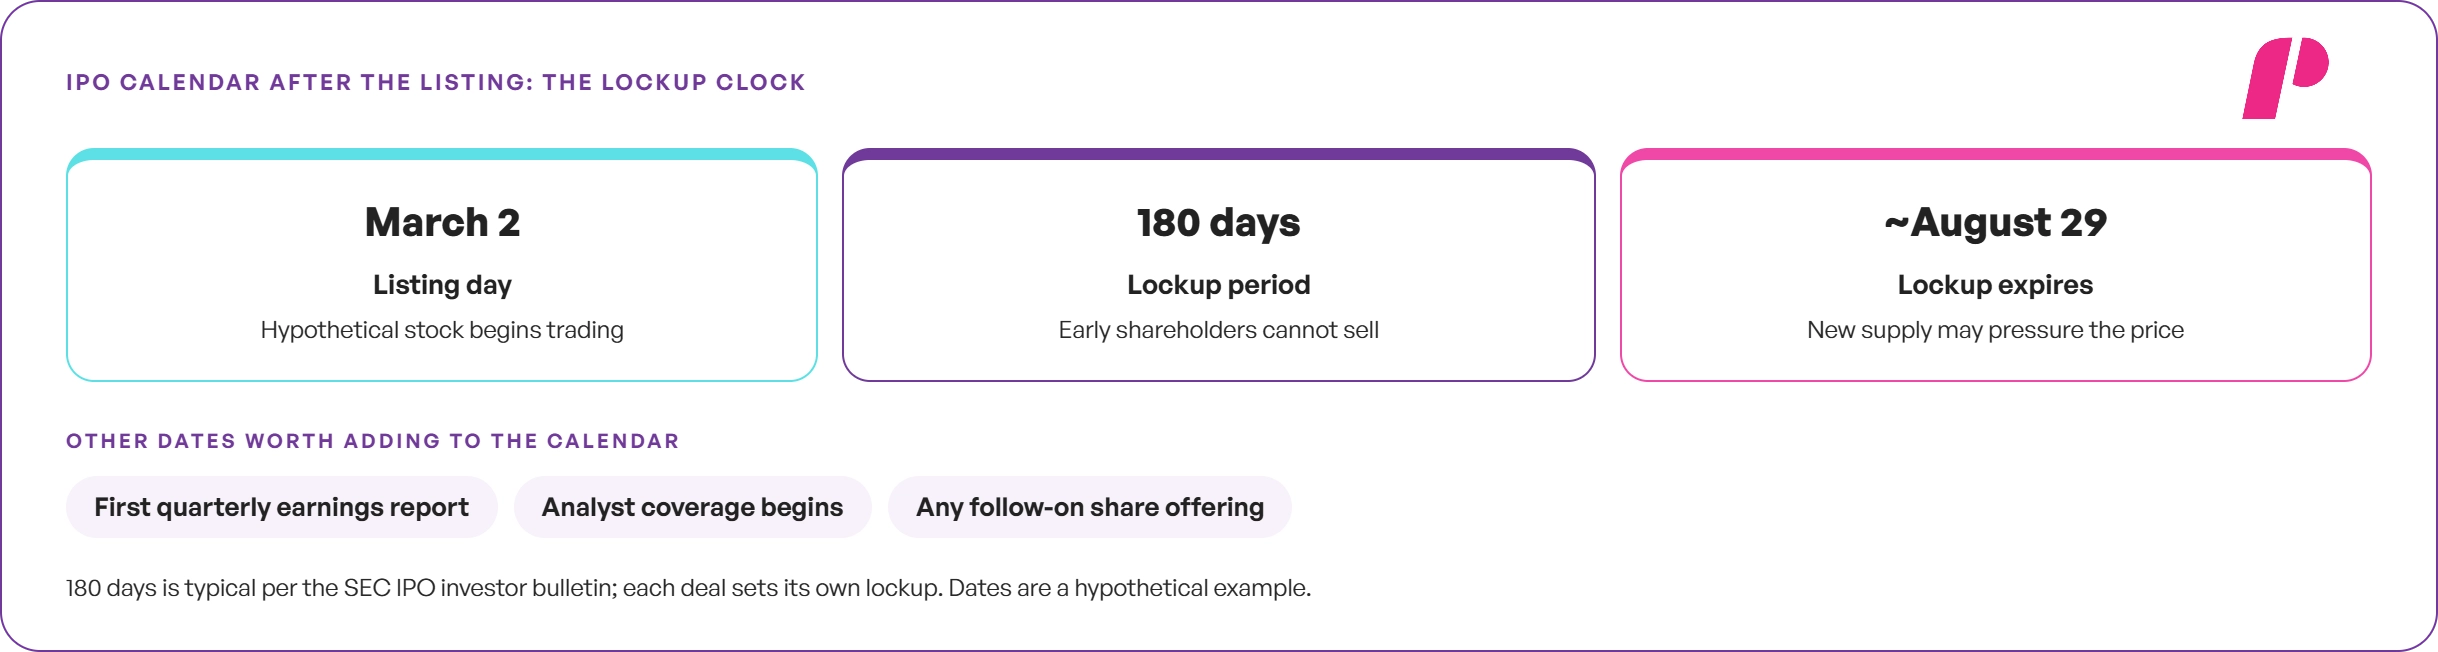
However, once a stock lists, a second date matters, because early shareholders usually cannot sell their shares right away. These holders sign a lockup agreement, and the IPO lockup period blocks their selling for a set time.
According to the SEC’s investor bulletin on IPOs, this period typically lasts 180 days after the offering.
Why Lockup Expiry Can Move Prices
As a result, many traders search for a related question: “What is an IPO lockup expiration?” It is the date when early shareholders become free to sell, which can add new supply to the market. Meanwhile, that new supply may pressure the share price around a date that was public from the first day.
🔗 What Is a Stock Catalyst? How to Find and Trade One Safely
How to Track Lockup Dates
For example, a hypothetical stock that listed on March 2 would see a 180-day lockup end around August 29. Some data sites keep a separate IPO lockup expiration calendar, so traders can mark these dates well in advance.
- Lockup expiry date, typically 180 days after the offering
- First quarterly earnings report as a public company
- Start of analyst coverage from the underwriting banks
- Any announced follow-on share offering
🔗 IPO Lockup Expiration: What Happens to the Stock
Using the IPO Calendar With a Funded Stock Account
IPO Volume as a Market Mood Signal
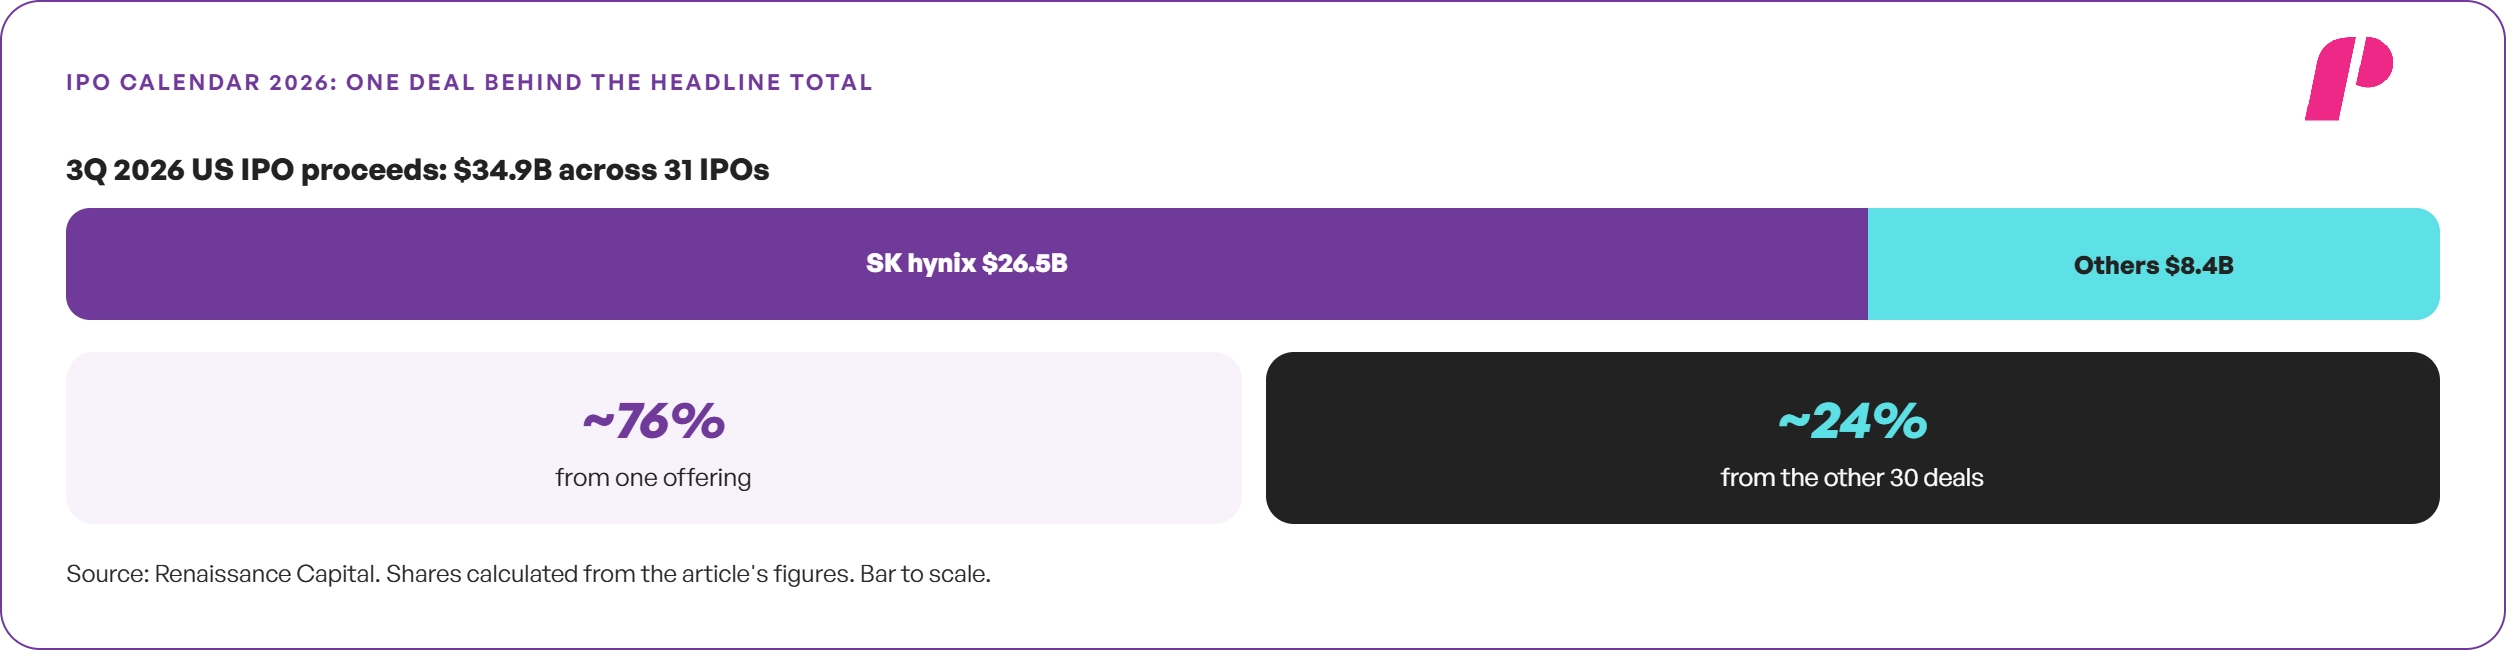
Renaissance Capital, which runs the Renaissance IPO calendar, counted 31 US IPOs raising $34.9 billion in 3Q 2026. However, SK hynix’s $26.5 billion offering supplied most of that IPO calendar 2026 total, leaving $8.4 billion.
🔗 Can SpaceX Justify a $1.8 Trillion IPO?
First-Day Volatility and Daily Loss Rules
Meanwhile, many traders still search for a simple answer to one question: “Is IPO trading profitable?” It depends on the plan: IPO trading can be profitable for some traders, yet wide swings make losses equally possible.
The SEC warns that prices shortly after an IPO can close well above or below the offering price.
🔗 Prop Firm Risk Rules: How to Trade Without Breaching Them
A Pre-Trade Plan for New Listings
Therefore, a funded trader decides before the open whether to trade smaller, wait several sessions, or skip the listing.
Furthermore, traders should check the program rules for newly listed stocks before they plan any trade around a listing.
Readers who want more on how to trade IPOs for beginners can find strategy guidance in a separate article.
Pre-Trade Checklist for New Listings
| Compliance Check | Example Entry / Program Parameter | Why It Matters / Risk Rationalization |
|---|---|---|
| New-Listing Rules Verification | [Copy directly from Prop Program Terms] | Confirms definitively that trading newly listed equities is permitted under current account rules |
| Daily Loss Limit Assessment | [Copy directly from Prop Program Terms] | Strictly caps the day’s worst-case financial outcome to prevent program drawdown breaches |
| Position Sizing Controls | Significantly smaller than standard position size | Accounts for the lack of established secondary trading history and high early volatility |
| Entry Execution Rules | No market orders placed prior to official exchange opening print | Avoids emotional chasing of the opening print and protects against erratic cross volatility |
| Exit Protocol Enforcement | Written stop-loss order placed prior to trade entry | Keeps the pre-planned risk framework in charge rather than emotional real-time impulses |
| Asset Skip Rule (Veto Protocol) | Skip trade if opening cross prints far above the offer price | Limits exposure to extreme parabolic swings and subsequent severe intraday mean-reversion |
🔗 IPO Trading – Strategies and Tips
Key Takeaways on Reading an IPO Calendar
An IPO calendar is most useful as a planning tool, not as a list of ready trades. Every expected date and price range can still change, and some deals vanish before pricing.
Therefore, an entry only becomes firm information once the company sets its final offer price. In short, the price range, deal size, and status explain the deal, while underwriters show who controls allocation.
Meanwhile, the lockup expiry, typically 180 days after the offering, is the second date worth a reminder. As the third quarter of 2026 showed, a headline total can hide weakness across smaller deals.
Furthermore, the routine improves with practice as traders compare expected terms with final prices each week. Over time, that comparison shows which deals tend to open calmly and which tend to swing hard. As a result, the calendar becomes part of a written plan rather than a source of impulse trades.
Therefore, traders who want to apply this discipline with firm capital can explore the Trade The Pool funded stock program. The program terms explain the risk rules that any plan for new listings should respect from the first trade.
If you liked this post make sure to share it!