If you own an ETF or a mutual fund, you are paying a fee you have probably never seen. No bill shows up in your inbox, and no charge appears on your brokerage statement. That fee is the expense ratio—the percentage of a fund’s assets used each year to cover its operating costs.
Instead, the cost is quietly pulled from the fund itself, a little each day, so most investors hold a fund for years without ever noticing it. That cost is called the expense ratio, and it is lower than most people think, but it is more important than it seems.
But what is an expense ratio exactly, and what makes for a good one or a bad one? The following will explain both in simple terms. You will learn how the fee is determined and collected, what exactly the fee covers, and what a good fee is in today’s market environment.
The gross/net fee mystery will be unraveled for you, and the magic of even half a percentage point will be explained by real numbers and math.
What This Guide Covers
- What an expense ratio is, and how the fee gets charged without ever sending you an invoice
- What the fee actually covers, from portfolio management to fund marketing
- What counts as a good expense ratio heading into 2026
- The difference between a fund’s gross and net expense ratio, and why it matters
- How a small, unnoticed fee compounds against your returns over time

What Is an Expense Ratio?
The expense ratio refers to the annual fee that a fund charges to operate itself, and it is calculated as a percentage of the amount invested in the fund rather than being charged as a flat fee.
This is important since it implies that the fee increases proportionately with the balance. For instance, a fund with an expense ratio of 0.50 percent will cost 5 dollars a year for every 1,000 dollars invested in it.
The percentage remains constant irrespective of the size of the account; this is the very reason it serves well for the purpose of comparison. Although the amount that gets paid out will be higher for the account that holds more money, the percentage rate remains the same.
As such, an investor who has an account of $5,000 and another having $500,000 can easily refer to the percentage rate of 0.20 percent to understand the proportion of their investment that will be used for expenses.
Investment Fundamentals: Expense Ratios, Operating Fees & Cost Mechanics (2026 Reference)
| Expense Ratio Feature | Detailed Operational Description & Metric |
|---|---|
| Core Definition | A mutual fund or ETF’s annual operating fee, expressed as a percentage of total assets under management. |
| Dollar Cost Example | A 0.50% expense ratio equals $5.00 per year in fees for every $1,000 invested. |
| Charge Mechanism | Directly deducted from fund assets and continuously reflected in the daily Net Asset Value (NAV). |
| Billing & Invoicing | No direct bill is sent; management fees are entirely invisible unless actively reviewed in documentation. |
| Where to Locate Fees | Official fund fact sheets, regulatory prospectuses, or online broker fund screeners. |
🔗ETFs
How the Expense Ratio Is Calculated and Charged
The math behind an expense ratio is straightforward, even if the way it is charged catches people off guard. The ratio of the fund is computed by taking the total annual cost incurred in operations and dividing it by the average net assets for that year.
In a case where the cost of operations is 200,000 dollars, and the average net assets are 100 million dollars, the result will be 0.002 or 0.20 percent when expressed in percentage terms. What surprises most investors is that this fee never arrives as a separate charge.
It comes out of the fund’s assets automatically and shows up as a small, continuous reduction in the fund’s net asset value, or NAV, each trading day.
You never write a check for it and never see a line item labeled “expense ratio” on a statement. The cost is real; it just hides inside a number you already check regularly: the fund’s price.
Expense Ratio Calculation: Step-by-Step Operating Cost Breakdown (2026 Reference)
| Calculation Step & Formula Parameter | Mathematical Value & Operational Output |
|---|---|
| Total Annual Operating Costs | $200,000 total fund operating expenses |
| Average Net Assets Under Management | $100,000,000 total net assets |
| Raw Cost-to-Asset Ratio ($200k / $100m) | 0.002 raw decimal calculation |
| Expressed as an Annual Percentage | 0.20% annual expense ratio |
| Actual Dollar Cost Per $10,000 Invested | $20.00 per year per $10k allocated |
🔗NAV
What the Expense Ratio Covers
An expense ratio is not a single charge. The cost is a compilation of several different costs, but when broken down individually, it becomes clearer why the total is so much.
In general, this includes costs for managing your portfolio, administrative and custodial costs, legal and accounting costs, as well as marketing and distribution costs called 12b-1 fees in the United States. That last piece is worth calling out on its own.
A 12b-1 fee is the slice of the expense ratio that pays for a fund’s marketing and distribution, named for the SEC rule that permits it, and it is one reason otherwise similar funds can charge noticeably different totals.

It’s also worth separating the expense ratio from two things it is commonly confused with. The management fee is only one component of the larger expense ratio, the portion paid to the people actually picking investments.
A sales load is a different animal entirely: a one-time charge to buy or sell certain mutual fund shares, not an ongoing annual cost like the expense ratio.
🔗Fund Fees
What Is a Good Expense Ratio?
What counts as “good” depends heavily on the type of fund you’re looking at, but the current benchmarks give you a real anchor. Index funds and ETFs in their passive form remain well under 0.20 percent, while the lowest rates can be found at 0.03 percent.
Actively managed mutual funds tend to be much higher in comparison, falling somewhere within the range of 0.50 to 1.00 percent because this rate is designed to pay for all activities involved.
2025 Industry Averages
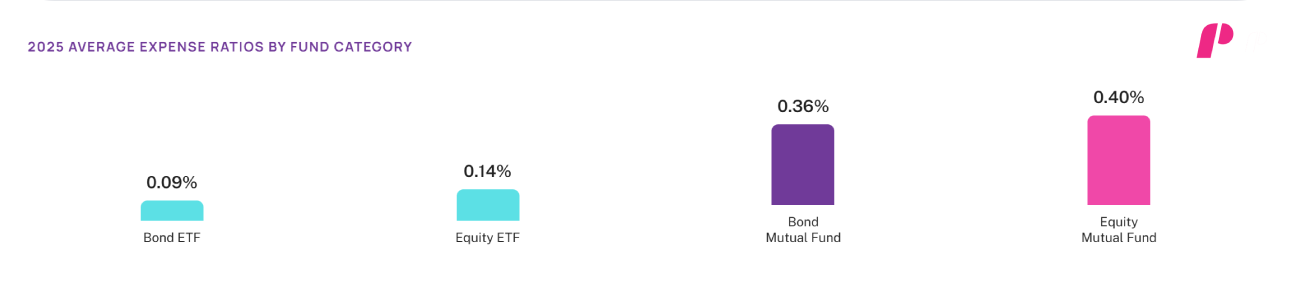
The 2025 averages from the Investment Company Institute make the gap concrete. Equity mutual funds averaged 0.40 percent, bond mutual funds averaged 0.36 percent, equity ETFs averaged 0.14 percent, and bond ETFs averaged just 0.09 percent.
This isn’t a new trend either. Fees across the industry have fallen steadily for nearly three decades as competition and the shift toward passive investing have pushed costs down.
Why Lower Usually Wins, But Not Always
As a rule, lower is better, since the fee is guaranteed every year while returns never are, so a cheaper fund keeps more of whatever the market delivers, all else being equal.
That said, “lowest wins” isn’t an absolute law. A slightly pricier active fund can still be worth its cost if it reliably outperforms its benchmark after fees, though the honest answer is that most active funds don’t manage that consistently.
A high expense ratio, on its own, isn’t proof of a bad fund, and a 0 percent expense ratio, which a handful of funds do advertise as a promotion, isn’t automatically a great deal either.
It pays to check whether other costs apply or whether that rock-bottom rate is a temporary offer rather than a permanent one. And a higher fee never guarantees better performance.
Most active funds fail to beat their benchmark once costs are subtracted, which means paying more often buys nothing but the fee itself.
Fund Fee Benchmarks: Average Expense Ratios Across Asset Classes & Management Structures (2025–2026 Reference)
| Fund Category & Vehicle | Typical Average Fee (2025 Benchmark) | Strategic Interpretation & Investor Takeaway |
|---|---|---|
| Equity Exchange-Traded Fund (ETF) | ~0.14% industry average | Low baseline cost driven primarily by passive index replication |
| Fixed Income / Bond ETF | ~0.09% industry average | Among the lowest structural operating fees available in public markets |
| Equity Mutual Fund | ~0.40% industry average | Higher average cost reflecting active management and administrative overhead |
| Fixed Income Mutual Fund | ~0.36% industry average | Consistently higher than equivalent bond ETF structures |
| Ultra-Low-Cost Index Funds | As low as 0.03% | Excellent cost efficiency; highly recommended for peer fee comparisons |
| Active Mutual Funds | Often 0.50% to 1.00% | Higher expense drag that must be justified strictly by superior after-fee alpha |
🔗Index Funds
Gross vs Net Expense Ratio
Funds often disclose two expense ratios, not one, and the gap between them can mislead a shopper who only glances at the lower figure. The gross expense ratio is the total operating expenses of the fund before deducting any discounts.
The net expense ratio involves subtracting any discount or waiver on fees made by the manager of the fund. This is the figure that is normally advertised since it sounds more appealing.
The catch is that a net figure isn’t necessarily permanent. Waivers expire on a schedule set by the fund company, and once they do, your actual cost can climb back toward the gross number.
That’s why comparing gross expense ratios gives you a better read on a fund’s sustainable, long-term cost rather than a temporary promotional rate.
You’ll find both figures listed side by side in a fund’s fact sheet, its prospectus, or any broker’s fund screener, so there’s no need to dig for them once you know where to look.
Fund Fee Analysis: Gross vs. Net Expense Ratios & Waiver Mechanics (2026 Reference)
| Comparative Feature | Gross Expense Ratio | Net Expense Ratio |
|---|---|---|
| Includes Temporary Fee Waivers? | No (excludes waivers and subsidies) | Yes (incorporates active fee waivers) |
| What the Metric Represents | Total standard operating cost of the fund | Actual cost charged after temporary manager discounts |
| Current Investor Payment Status | Not always what is currently paid | Yes, reflects what you pay right now |
| Reflects Long-Term Operating Cost? | Yes, it indicates true sustainable cost | Can rise toward the gross figure over time |
| Strategic Significance & Risk | Shows baseline operating expenses | Waivers can expire suddenly without warning |
🔗Fee Waivers
How the Expense Ratio Affects Your Returns
A fraction of a percent sounds too small to matter until you watch it compound. Because the fee is deducted every year regardless of how the fund performs, even a modest gap between two similar funds widens steadily the longer you hold them.
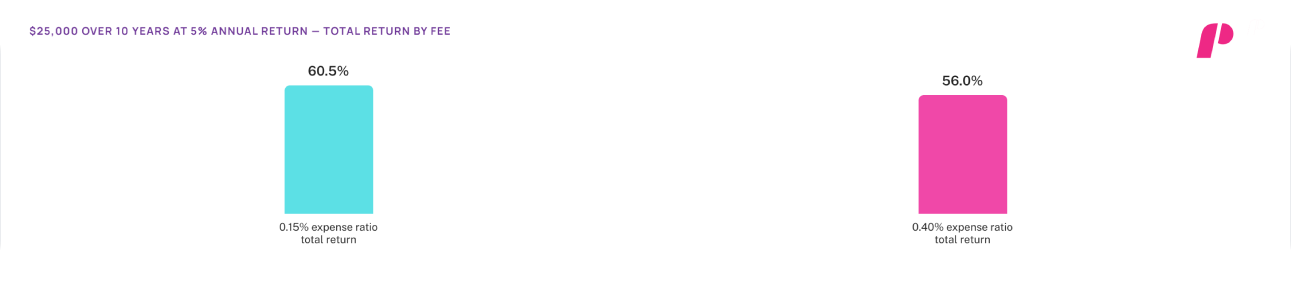
Fidelity illustrated this with a simple comparison: 25,000 dollars invested for 10 years at an assumed 5 percent annual return grew to a 60.5 percent total return in a fund charging 0.15 percent, versus 56 percent in a fund charging 0.40 percent. That gap of roughly 4.5 percentage points came from nothing but the fee difference.
It’s also worth being honest about the flip side of that math. A 1 percent expense ratio can sound negligible on paper, but it isn’t harmless, since compounding turns that small annual slice into a genuinely large sum across several decades.
And strong past performance doesn’t excuse ignoring the fee either, because the expense ratio gets charged every single year, no matter how the fund did, while good results are never guaranteed to continue. Keeping more of your return really comes down to a short checklist:
- Check both the gross and net expense ratios before you buy
- Compare fees across funds that track the same index
- Favor lower-cost funds when the underlying strategy is otherwise similar
- Confirm whether a low net fee comes from a temporary waiver
- Judge an active fund by its after-fee track record, not its marketing
- Remember that trading costs are separate from a fund’s expense ratio
🔗Compounding
A Trader’s Note on Fund Fees
For traders who spend most of their time in individual stocks, a fund’s expense ratio works differently from the costs they’re used to tracking, though both quietly chip away at results.
An expense ratio is charged continuously, embedded in a fund’s NAV for as long as you hold it. A trader’s own costs, like commissions and bid-ask spreads, are charged per transaction instead, showing up only when a position opens or closes.
🔗Bid-Ask Spread
Neither type of trader-focused platform, including Trade the Pool, charges an expense ratio, since that’s strictly a fund-investing cost rather than something tied to trading a funded account.
But the two cost structures are worth understanding side by side, particularly for anyone who trades actively and also parks some capital in ETFs. Watching both, for different reasons, is simply part of managing total cost as a market participant.
Transaction Cost Analysis: Expense Ratios, Commissions & Bid-Ask Spreads (2026 Reference)
| Cost Type & Category | Operational Definition & Mechanics | Payment Timing & Frequency |
|---|---|---|
| Expense Ratio | A fund’s annual operating and management fee | Continuously, embedded directly in daily NAV |
| Brokerage Commission | A per-trade transaction charge levied by brokers | Each time you execute a trade |
| Bid-Ask Spread | The implicit gap between market bid and ask prices | Each time you enter or exit a position |
| Key Structural Distinction | Fund operating fees and direct trading execution costs are entirely separate | Do not confuse the two when tallying portfolio drag |
A Small Number Worth Checking Every Time
The expense ratio is one of the smallest figures printed on a fund’s page, yet it’s also one of the most worth double-checking before you commit money. It is guaranteed to be charged every year, while a fund’s returns never come with that same guarantee. Reading the number before you buy is one of the few fee decisions that stay entirely in your hands.
The core rules are simple once they click. Index funds and ETFs tend to run cheap, while actively managed funds carry a higher price tag that only pays off if performance after fees keeps up.
The gross figure represents the real, sustainable long-term cost, while a low net figure can reflect a temporary waiver that eventually expires. A quick comparison between the two, done once before you buy, can protect years of compounding.
Small fees compound into large differences given enough time, but so does the habit of paying attention to them. Making a habit of checking the expense ratio before every fund purchase costs nothing and takes a minute. To sharpen how you think about market costs and trading decisions more broadly, explore the Trade the Pool education hub for more guides like this one.
If you liked this post make sure to share it!