
Introduction
As we proceed in our discovery journey into swing trading, some of you might have wondered what strategies traders are finding more helpful and effective. This is why, in today’s article, we’ll look at the five most popular indicator-based swing trading strategies that experienced traders use to navigate the stock market.
We’ll discuss the Fibonacci strategy, Channel trading strategy, Moving Averages Crossover strategy, Bollinger Bands strategy, and a bit on Fundamental Analysis strategy to keep you all well-rounded.
Ready?
Let’s go straight to it!
The 5 most popular indicator-based swing trading strategies
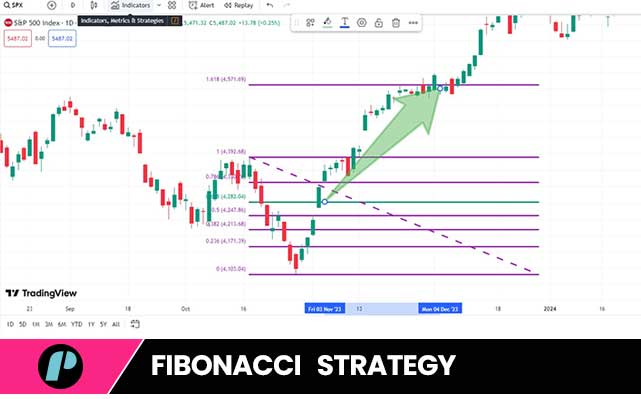
1. Fibonacci Strategy
Fibonacci retracements are a favorite among traders who enjoy mixing math with their trading. This strategy focuses on finding potential support and resistance levels using the Fibonacci sequence.
Read more about Fibonacci Retracements
How it Works:
First, identify a significant price move—either up or down. Then, draw horizontal lines at key Fibonacci levels (23.6%, 38.2%, 50%, 61.8%, and 78.6%) between the low and the high of a bullish move or between the high and the low of a bearish move.
These levels become your potential zones of support or resistance.
Why It’s Popular:
Its simplicity and effectiveness are the key factors that make the Fibonacci strategy so popular. Many experienced traders believe these levels are almost self-fulfilling prophecies because so many people use them.
Swing Trading Application:
If a stock retraces to a Fibonacci level and shows signs of reversing, it sets the stage for a trade.
Usually, you’d buy at the 61.8% level if the stock is bouncing back or short it if it fails to break through.
This strategy relies on patience and precision, making it a staple in swing trading strategies.
Key Notes
Remember:
- When swing trading, charts are normally set to daily or weekly timeframes depending on trading style.
- Swing traders are less sensitive to rapid price movements due to news than day traders, but Fundamental analysis still plays an important role, and macro events can make or break your trades.
- When using indicators-based strategies, it’s always best to also use at least another one for confirmation.
2. Channel Trading Strategy
This strategy focuses on visualizing a stock’s movement within a defined range—essentially, the stock oscillates between two parallel lines, or “channels.” Imagine it like a game of ping pong; the stock price bounces between support and resistance.
How it Works:
You identify the upper and lower trendlines that the stock price seems to follow. These lines create the “channel.”
Take the stock reaching the top of the channel as your signal to short and price hitting the bottom as a signal to buy.
Why It’s Popular:
Traders love this strategy because it’s so visually straightforward. Additionally, it’s effective in markets that aren’t trending strongly in one direction and moving horizontally instead.
Swing Trading Application:
Take advantage of any stock’s expected reversal at the channel boundaries. The predictability here is key: if the stock price remains within the channel, it can offer multiple profitable trades during the same consolidation periods.
3. Moving Averages Crossover Strategy
The Moving Averages Crossover strategy is a reliable method that uses the crossing of moving averages to indicate buying and selling opportunities.
It’s simple but can be very effective when used correctly.
How it Works:
You’re going to have to use two moving averages here: a short-term and a long-term one. (For swing trading, traders usually opt for the 50-day moving average (MA) and the 200-day MA).
A bullish crossover happens when the shorter MA crosses above the longer MA, signaling a buy. Conversely, a bearish crossover occurs when the shorter MA crosses below the longer MA, signaling a sell.
Why It’s Popular:
It’s easy to grasp and implement. Plus, it works well in trending markets, helping you catch significant moves while filtering out the noise.
Swing Trading Application:
Enter trades based on these crossover signals, holding your position until an opposite crossover occurs.
This swing trading strategy leverages momentum and trends to maximize gains.
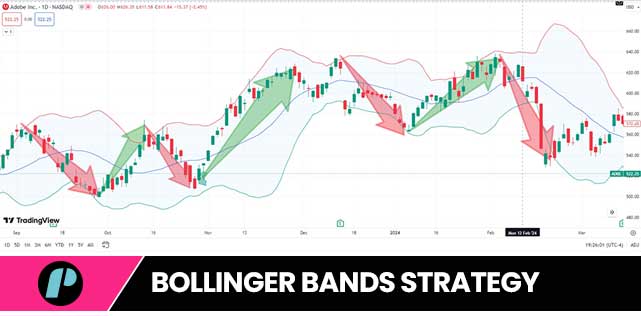
4. Bollinger Bands Strategy
Bollinger Bands are essential for traders who focus on volatility.
Created by John Bollinger, this tool includes a middle band (a simple moving average) and two outer bands that show standard deviations above and below the middle band.
How it Works:
When the stock price hits the lower band, it’s considered to be oversold, suggesting a buying opportunity might arise. When it touches the upper band, it is said to be overbought, indicating it might be time to sell.
Why It’s Popular:
Bollinger Bands offers a flexible measure of market volatility and adjusts as volatility changes. It is this adaptability that makes the Bollinger Bands strategy a favorite among swing traders.
Swing Trading Application:
You can trade on the bounces off the bands (consolidations) or use it with other indicators. Swing traders establish entry and exit points when the stock price stays within the bands and moves towards the mean level.

5. Fundamental Analysis Strategy
Not all swing trading strategies rely solely on charts and technical indicators: enter Fundamental Analysis!
This strategy examines the underlying business’s financial health and news to make trading decisions, making it more thoughtful but highly profitable when done right.
How it Works:
Analyze key metrics like earnings, revenue, profit margins, financial ratios, management changes, new produtc/service launches, etc. as well as current and future opportunities and threats. Look at things like the P/E ratio, or review quarterly reports to understand the company’s future potential.
Why It’s Popular:
While this is a long-term investor’s staple, swing traders use it to find stocks with solid potential that might be undervalued.
Swing Trading Application:
Swing traders using fundamental analysis often combine it with technical indicators to better time their entry and exit points. For example, if a fundamentally strong stock’s price is nearing a support level on the chart, it might be a good time to buy.
Key Notes
Trade the Pool has recently launched a program tailored specifically to swing traders.
It also includes:
- Almost any stock and ETF in the U.S. markets.
- Overnight and over-the-weekend position holding allowed.
- Reach 3 times your max DD. If your max DD = $2,100, reach $6,300 in profit and get a TTP-funded account
Conclusion
So, there you have it. The five most popular swing trading indicator based strategies every trader should know and master.
Using the Fibonacci strategy for pinpointing support and resistance, channel trading for capturing bound movements, moving averages crossover for trend following, Bollinger Bands for managing volatility, and fundamental analysis for a holistic approach provides a solid framework to navigate the markets.
Swing trading isn’t about the number of strategies you know; it’s about how effectively you can apply the ones that suit you best. So why not choose a few of these strategies, get proficient with them, and see how they improve your trading game?
Happy trading!
I hope this help.
If you liked this post make sure to share it!