
Introduction
Fibonacci Retracements are powerful technical analysis tools based on the Fibonacci Sequence which are widely used in the financial trading of virtually any and every asset.
Many traders use technical indicators – and sometimes entire strategies – built upon Fibonacci Retracements, while many others use the retracement levels as a guide to set their stop-loss and take-profit orders. But how can a sequence of numbers discovered in medieval times have any applications in trading today?
In this article, we will explore what Fibonacci retracements are, how they work, and how traders can make them part of their trading strategies.
What is the Fibonacci Sequence?
The Fibonacci Sequence is a mathematical sequence of numbers discovered in India and brought to Europe by Leonardo Fibonacci sometime during the 13th century.
The sequence begins with 0 and 1 and carries on with each following number being the sum of the previous two; so.. 0, 1, 1, 2, 3, 5, 8, 13, 21, and so on.
Mathematically speaking, the Fibonacci Sequence and the relation between the numbers it contains can be found reflected everywhere in nature (for example in the shape of chicken eggs, many plants, flower petals as well as galaxies, and much more) but the reason it’s so interesting to traders is, intuitively, a different one.
What are the applications of the Fibonacci Retracements in financial trading?
In financial markets, traders use the ratios, derived from the Fibonacci Sequence, to predict the range and the extent of potential price retracements. Prices corresponding to these ratios are referred to as “Fibonacci Retracements”.
There are many ways and variations to use the Fibonacci Retracements and there is a myriad of technical indicators adopting each a slightly different way of showing the retracement levels on the charts -however- they are all more or less based on the same principle and pretty much all work in a very similar way.
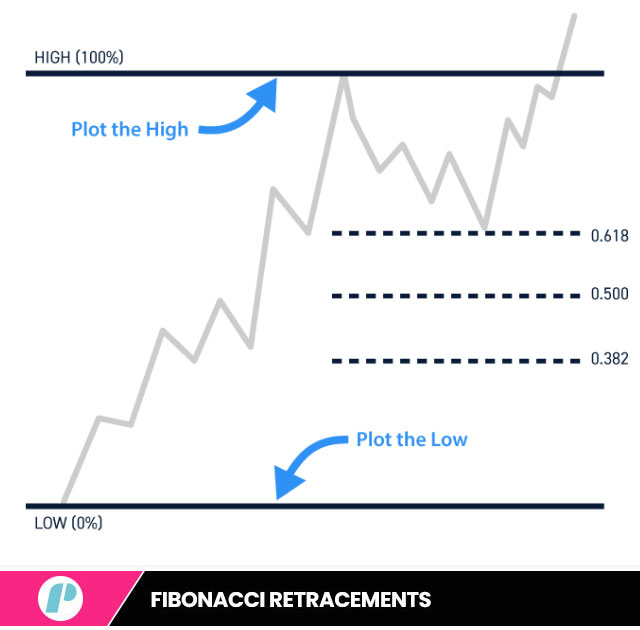
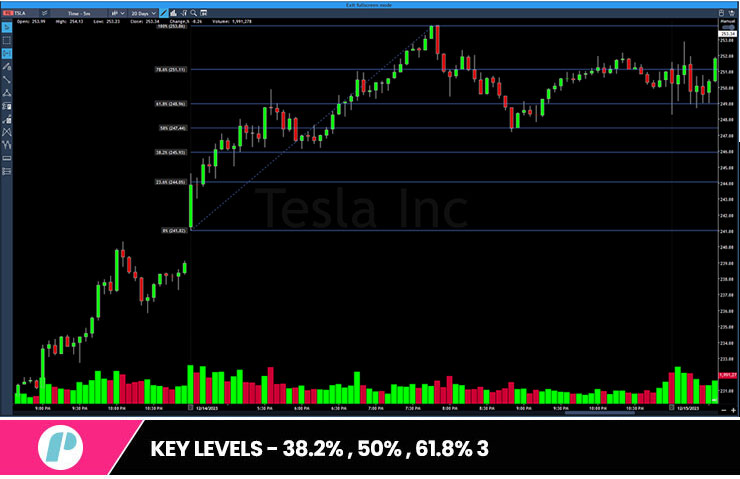
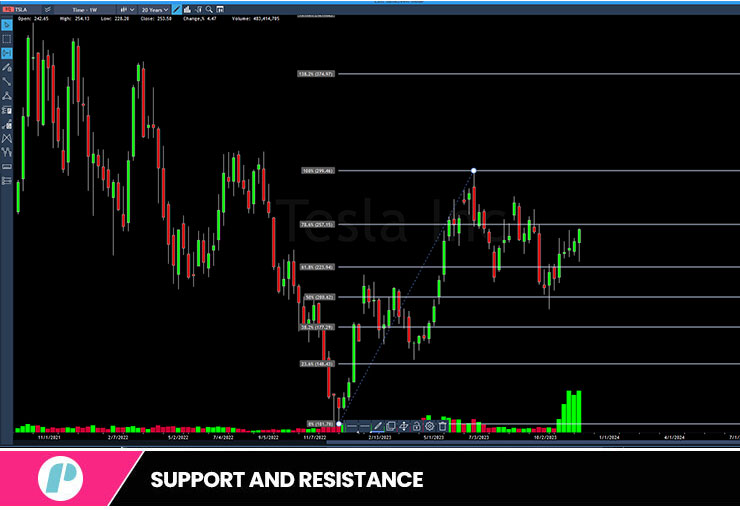
Fibonacci retracements are plotted on a price chart as horizontal lines indicating potential support and resistance levels. The two main points used to draw these lines are the Swing High and the Swing Low. The Swing High represents a peak in price, while the Swing Low represents a trough. A retracement is then drawn between these two points, dividing the vertical distance by various Fibonacci ratios.
Traders use the Fibonacci Retracements’ levels to establish potential entry and exit points for their trades as well as their stop-loss and take Profit orders.
Naturally, even when using any Fibonacci retracement indicator, traders would still examine and confront the results of additional technical analysis tools (such as candlestick patterns and trend indicators), to confirm the probability of a reversal or continuation before opening a position.
What are the key Fibonacci Retracement Levels:
Fibonacci retracements rely on percentage levels derived from the Fibonacci sequence. The three most prevalent levels are 38.2%, 50%, and 61.8%. These are thought to represent levels of support or resistance, when price may stall or reverse. Traders also employ additional Fibonacci levels, such as 23.6% and 78.6%, in order to gain better insight into further price movements.
How are Fibonacci Retracements used when trading?
As we said, there are many methods to trade using Fibonacci Retracement; what follows is one of the most basic and most common of such methods.
To use and make Fibonacci Retracements part of your trading strategy, it must be remembered – and we can’t stress this enough – that no strategy should be ever based upon one single indicator and Fibonacci Retracements are no different.
In order to ensure to draw the Fibonacci Retracements in the right direction, a trader needs to consult and compare the results of other market analysis tools (technical and/or fundamental) to identify the current trend and a bias on the likelihood of potential changes.
What’s next?
Once that is done, a trader needs to identify the Swing Points (the high and low points on the price chart that mark the start and the end of significant moves) and use a Fibonacci Retracement tool to draw the lines from the swing low to the Swing High (in an uptrend) or from the swing high to the Swing Low (in a downtrend).
As you draw the line according to the current trend, most Fibonacci Retracement tools will display horizontal lines across the chart; each of these represents a different Fibonacci Sequence ratio and therefore a different Fibonacci Retracement level.
With the Fibonacci Retracement lines across the charts on his or her screen, a trader should now spend some time analyzing how price reacts when approaching each retracement level.
Very often, support and resistance areas can occur near these levels as well as retracement and price reversals.
Before opening a position, a trader should look for confirmation and confluence with other indicators. Confirming signals from multiple sources can strengthen any trading decision. This is why it’s advisable that traders combine Fibonacci Retracements with other technical indicators or chart patterns to increase the probability of the trade being successful
Let’s finish it off!
Once all of the above is done, all a trader needs to do at this point is to follow the results of his analysis and use the Fibonacci Retracement levels to set entry and exit points for his position (as well as stop-loss and take-profit orders) whilst keeping in mind that support and resistance levels, price reversals, bounce-backs, and pull-backs are all likely to occur around the Fibonacci Retracement levels.
Hope this helps!
Happy trades!
If you liked this post make sure to share it!