
Introduction
This is the third and last part of the trilogy on the RSI and MACD indicators in stock trading. In the first article of the series we found out the reasons why the RSI and the MACD indicators are so popular amongst stock traders; in the second article, we learned the most popular stock trading strategies based on the RSI and today, this third part, is all about the MACD indicator and the ways traders incorporate it in their strategy.
What is MACD?
Before diving into strategies though, let’s first remind ourselves once again what the MACD indicator actually is and how it works.
At its core, the MACD is a trend-following momentum indicator that helps traders spot changes in the strength, direction, momentum, and duration of a trend in stock prices.
The MACD indicator is formed of three main components:
-
The MACD Line
This is the difference between two exponential moving averages (EMAs) – typically the 12-day and 26-day EMAs.
-
The Signal Line
This is a 9-day EMA of the MACD line. It’s used to trigger buy and sell signals.
-
The Histogram
This represents the difference between the MACD line and the signal line. It gives a visual representation of changes in momentum.
Key Notes
The effectiveness of MACD can vary depending on the market conditions. In a trending market, MACD can be a reliable indicator, helping you ride the trend. However, in a sideways or choppy market, you might get more false signals.
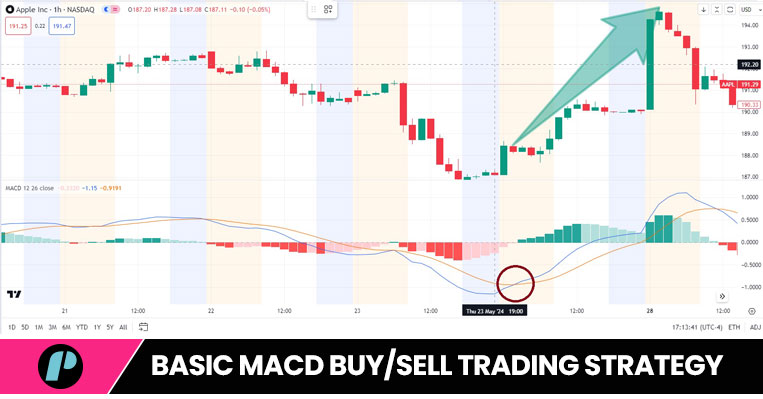
Basic MACD Buy/Sell Trading Strategy
One of the core tactics in technical analysis is the MACD Line Cross.
The MACD line and the signal line are the only two things that matter in the basic MACD strategy. It simply involves entering a trade long when the MACD line crosses above the signal line or entering the trade short when the MACD line crosses below the signal line.
Execution
Buy signal: Buy or prepare to buy when the MACD line ascends above the signal line.
It suggests that prices are poised to rise.
Sell signal: Sell or prepare to sell when the MACD line dips below the signal line.
It signals a potential price decline.
MACD Divergence Strategy
Another significant principle in MACD trading strategies is divergence.
Divergence occurs when the MACD indicator moves in the opposite direction to the stock’s price.
The MACD Divergence occurs when the price reaches new highs or lows, but the MACD fails to follow suit, indicating a potential change in trend. Bullish divergence happens when the price makes a lower low, but the MACD forms a higher low, suggesting upward momentum. Conversely, bearish divergence occurs when the price hits a higher high, but the MACD charts a lower high, hinting at a potential downturn. This strategy helps traders make informed decisions about entering or exiting trades.
Execution
Buy signal: buy or prepare to buy when the MACD indicator shows a bullish divergence (price sets a new low while the MACD does not).
It hints that the downtrend is faltering, with a potential upward reversal on the horizon.
Sell signal: sell or prepare to sell when the MACD indicator shows a bearish divergence. (price reaches a new high, but the MACD fails to follow suit).
It implies that the uptrend is losing steam, possibly leading to a downward reversal.

The MACD Triple Crossover Strategy
The MACD Triple Cross Strategy involves using three exponential moving averages (EMAs) to identify potential trading opportunities. It combines the Moving Average Convergence Divergence (MACD) indicator with two additional EMAs. When the MACD line and signal line both cross above the EMAs, it signals a potential buy; when they cross below, it signals a sell.
Execution
Buy signal: buy or prepare to buy when the MACD line and the signal line cross above all three the EMAs.
Sell signal: sell or prepare to sell when the MACD line and the signal line cross below all three EMAs.
The MACD Histogram Approach
The histogram part of the MACD indicator is intuitive and highly practical.
Positive and increasing histogram bars indicate growing bullish momentum. On the contrary, negative and decreasing bars point to strengthening bearish momentum.
Combining MACD with Other Indicators
Although the MACD is an effective standalone indicator of momentum, its accuracy can be enhanced even further when used in conjunction with other tools (some of which we already know) Consider these strategies:
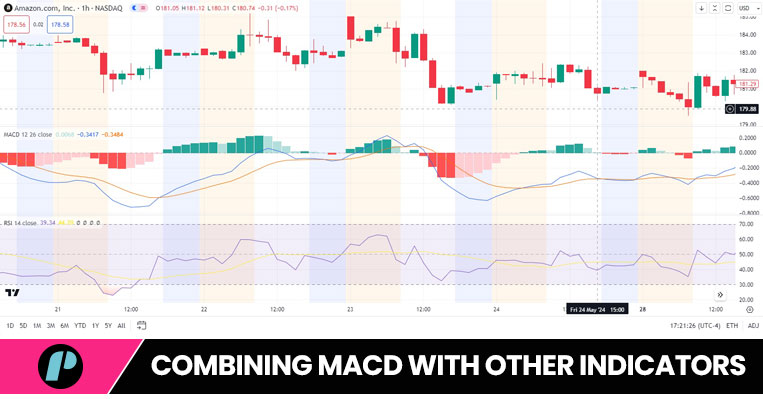
MACD with RSI Strategy
Having both the RSI with the MACD on a chart at the same time allows traders to analyze a stock’s price through both indicators in real time and this, often, can lead to a highly effective trading approach.
The RSI evaluates the velocity and magnitude of price fluctuations, primarily to detect overbought or oversold market conditions. Conversely, the MACD assesses trend direction and momentum by comparing moving averages. When the RSI identifies an overbought or oversold scenario and the MACD confirms it with a bullish or bearish crossover, it strengthens the credibility of the trading signal.
For example, a buying opportunity is presented when the RSI falls below 30 (signifying oversold) and the MACD line crosses above its signal line, pointing to a possible upward trend reversal. This method capitalizes on both momentum indicators and trend-following elements, thereby enhancing the precision of trading judgments.
MACD with Fibonacci
This strategy combines the MACD with Fibonacci retracement levels to identify potential trade entries and exits. Traders look for MACD crossovers near key Fibonacci levels (38.2%, 50%, 61.8%) to confirm trend reversals or continuations, offering a robust framework for strategic decision-making in volatile markets.
Execution
Buy signal: buy or prepare to buy when the MACD crosses above the nearest Fibonacci level.
Sell signal: sell or prepare to sell when the MACD crosses below the nearest Fibonacci level.
Conclusion
The RSI and the MACD are both very versatile tools and, whether you use them together or separately, they are bound to help you take your trading to the next level by allowing you to spot trends and potential reversals.
Just remember, no indicator is foolproof. Always use RSI and MACD in conjunction with other tools and maintain good risk management practices.
Hope this helps.
If you liked this post make sure to share it!