
Introduction
Traders nowadays have an almost infinite number of technical analysis tools at their disposal with technology playing a vital part in bringing them to the screens of retail traders worldwide too. This vast availability of indicators, however, does not mean that traders cannot create new ones or adapt old ones to better fit their trading style and strategy. The Displaced Moving Average is a great example of this and, just as you might have guessed, is also the topic of this article.
We are about to find out what the Displaced Moving Average is and how to make it part of your strategy.
What is the Displaced Moving Average?
Created as a variation of the simple moving average (SMA), the Displaced Moving Average (DMA) is a technical indicator widely used in trading to analyze market trends from a different perspective on market momentum although many traders also employ DMA as part of their strategy to identify potential entry and exit points.
The DMA involves traders shifting the SMA forward or backward in time on their chart to create a displaced version of the average. By doing this, the DMA visually separates the moving average line from the current price action pattern, allowing traders to compare the price’s relationship with the displaced average line.
Let’s start by saying that the SMA is the arithmetic mean of a specific number of data points over a given length of time. For example, a 20-period SMA (SMA20) calculates the average closing price over the last 20 periods. On a chart, the SMA is almost always represented by a colorful line above, below, or across the candlestick depending on the time frame.
Once the definition of SMA is clear, we can carry on and say that to calculate the Dispaced Moving Average, traders need to choose the desired time displacement and apply it to the SMA formula.
By applying a displacement value to the SMA, traders are able to effectively shift the moving average to the left or right on the chart as they prefer and can do this in any number of periods, allowing them to customize the DMA based on their needs, analysis, and trading strategy.

Why would traders want to use a Displaced Moving Average rather than a Simple Moving Average?
Distorting and interfering with a good old technical indicator could seem foolish to some people but there are many good reasons for traders to do so. In this specific case, the main reason why so many traders also use the DMA in their analysis is to smooth out price fluctuations and identify potential trends. It helps traders to filter out short-term noise and focus on the broader market trend instead.
By visually separating the DMA from the price, traders can see if a stock price is trading above or below the displaced average which, in itself, can be an insight into many other pieces of information. However, in a broader sense, it is commonly accepted that price above the displaced moving average suggests a bullish market sentiment, indicating potential buying opportunities, and that, conversely, price below the DMA signals a bearish sentiment, suggesting possible selling opportunities.
5 simple DMA Strategies you can try right now.
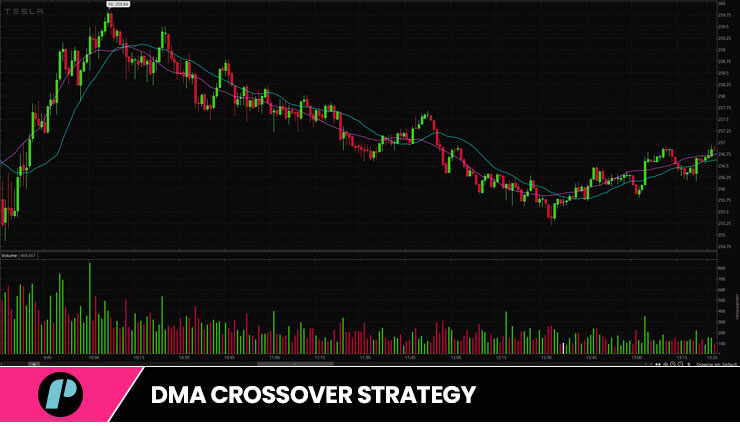
DMA Crossover Strategy
This strategy involves using two DMA lines, one representing a shorter time frame than the other. When the shorter DMA line crosses above the longer one, it generates a buy signal and vice-versa.
Displaced Moving Average Reversal Strategy
With this strategy, traders analyze the price action in relation to the displaced moving average. When the price crosses above the DMA line, it indicates a potential bullish reversal and generates a buy signal. When the opposite happens, it should indicate a sell signal.
DMA Breakout Strategy
Traders can use DMA lines to identify potential breakouts too. They wait for the price to close above or below the DMA line to confirm a breakout. A candle close above the DMA line suggests a bullish breakout, while a close below it indicates a bearish one.
DMA Trend-following Strategy
This strategy involves confirming the overall trend using DMA lines. If the price is consistently trading above the DMA line, it suggests a bullish trend. Conversely, if the price is trading consistently below the DMA line, it suggests a bearish trend. Traders can then take trades in the direction of the trend.
DMA Support and Resistance Strategy
DMA lines can also be used to identify support and resistance levels. Traders observe how the price reacts when it reaches the DMA line. If the price bounces off the DMA line, it acts as a support level. If the price fails to break above the DMA line, it acts as a resistance level. Traders can then take trades based on these support and resistance levels.
The Author’s Way of Displaced Moving Average!
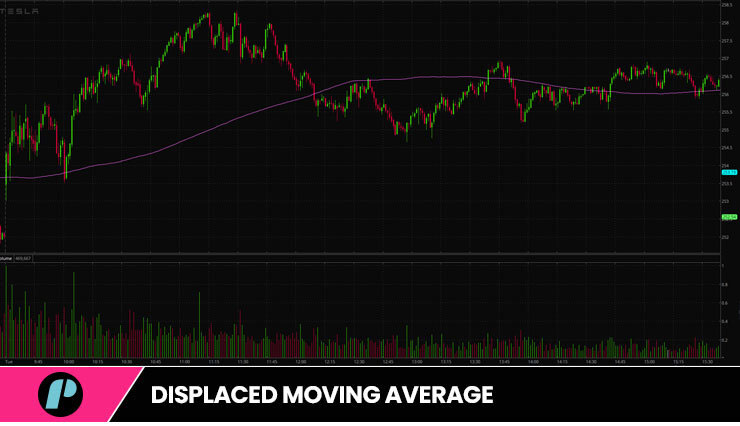
In the main image of this article, I represented the way I personally like to use the DMA.
Very simply, I draw three different DMA lines on the chart, set them to my preference, and wait for price to cross all three lines in either direction.
The first red candle that opens and closes below all three lines indicates a strong bullish bias. Similarly, the first green candle to open and close above all three lines signals a possible bullish move.
Remember
When using the displaced moving average, remember that different displacement values will show different results. You need to experiment with different periods to find the value that suits their trading style and the specific market they are analyzing.
Well, best of luck, traders!
I hope this helps.
If you liked this post make sure to share it!