Indicators For Day Trading
Before starting to trade with indicators for day trading, you must remember one thing that will change the way you will use indicators:
All indicators are created from the price or volume. That means that anything you see in an indicator you can basically see on the chart, so if there is one very important tip that I can give you is: learn the chart and the volume first, understand how to read them professionally, and only then add indicators to help you make the best decision, and not the opposite around.
Most traders get trapped by using too many indicators, which in the end leads to bad decision-making and losing trades.
That being said, the perfect way to find out which technical indicators work best for your trading strategy is to experiment with them individually and then in combination. Depending on the asset you’re trading or the market conditions, you may decide to stick with a few that are evergreen, such as Exponential Moving Average, or you may switch off some of them.
The Importance of Intraday Indicators
The indicator’s role began in the early 70s with the arrival of computers, where computer scientists tried to build the holy grail that would predict market movements.
In the beginning, it actually worked, and some indicators made amazing returns for their creators. However, in time, those indicators became the knowledge of the rule, and other algorithms tried to copy them or compete with them.
These days indicators still play a big role as one of the most important parameters when making a decision to enter a trade, but as I’ve mentioned before, make sure you first understand the chart and volume and only then get another confirmation from the indicator that you are working with.
Intraday Indicators
Day traders of all assets, stocks, futures, forex, etc., will use an indicator for 3 main reasons:
- Help to understand if the stock is in an overbought/oversold, which can indicate the end of a trend.
- Find an imbalance between chart parameters to indicator parameters, which can indicate the beginning of a trend.
- Show a clear direction of a trend.
Make sure to read all the way to the end of this article where I share my favorites indicators and how I use them.
Trend
According to the indicators, the market is trending or moving in one direction. Trend indicators tend to oscillate between highs and lows, typically oscillators.
Momentum
Momentum indicators show how strong the trend is and whether a reversal is likely. A momentum indicator is the relative strength index (RSI), which indicates the top and bottom of prices.
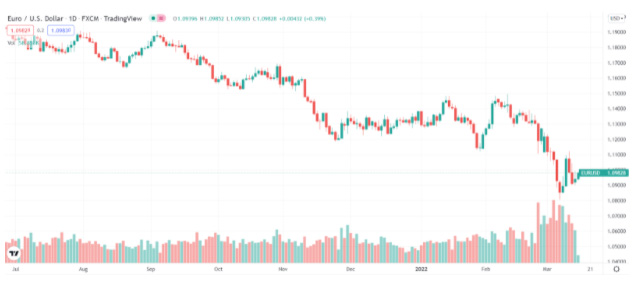
Volume
The volume provides information about how volume has changed over time. And how many stocks have been bought and sold. Price changes indicate how significant the difference will be on volume. Among the volume indicators are the On-Balance-Volume.
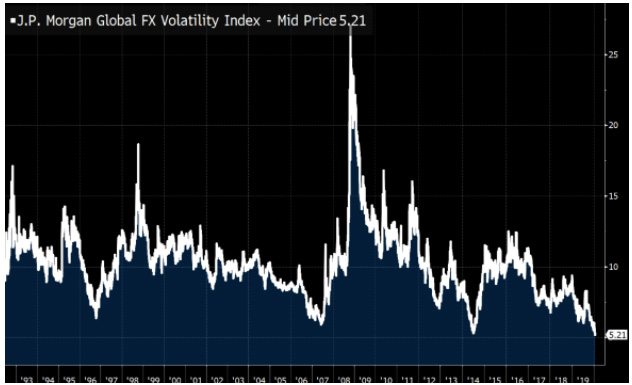
Volatility
Indicating how much a price change in a given period is one of the most critical indicators. The volatility provides this information: the lower the volatility, the more significant the difference.
Best Intraday Indicators
To better predict the market’s behavior, traders use hundreds of different technical indicators today. According to their function, trading indicators are often categorised for simplicity. A few common indicators to consider are oscillators, volume, volatility, support and resistance, trend-following, and more.
The secret to day trading success, according to some investors, is indicators. Is this the case, and if so, what indicators are the best? Our complete guide will show you how to use day trading indicators to complement your trading strategy.
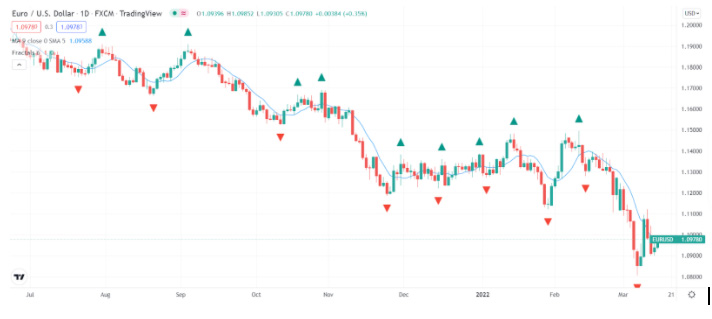
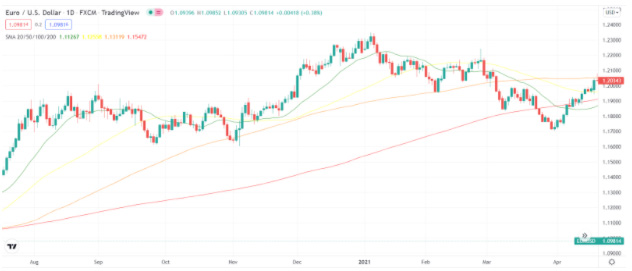
Moving averages
An intraday trading indicator frequently used is moving averages. These indicators present market momentum, trends, reversals of trends, stop-loss, and stop-loss levels. A moving average can help traders determine the direction of the current market trend to find trade opportunities.
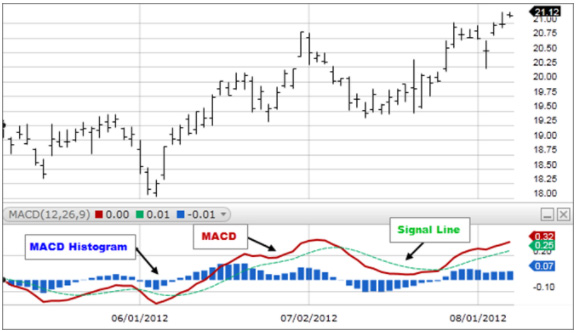
Moving Average Convergence/Divergence (MCAD)
An indicator that displays the relationship between two moving averages of a security’s price is Moving Average Convergence Divergence (MACD). To calculate the MACD, we subtract the 12-period exponential moving average (EMA) from the 26-period EMA.
A divergence signal is an effective way to use the MACD histogram to trade, but using it as a forecasting tool may not be a good idea. Because past data will only include successful divergence signals, divergence trades aren’t as accurate as they seem in retrospect.
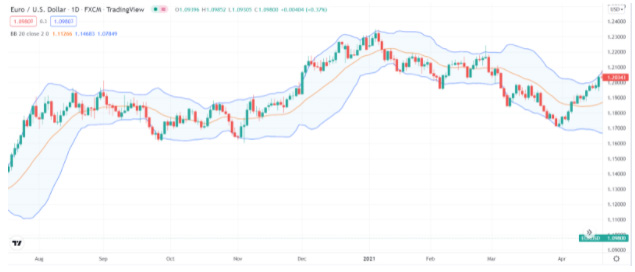
Bollinger bands
Bollinger bands are a measure of market volatility. Bollinger bands comprise three types of bands: a middle band, which is a simple moving average of 20 days, an upper band of +2 standard deviation, and a lower band of -2 standard deviation.
An increase in its lower price usually accompanies a stock’s price increase. When there is more volatility and the market moves, the band widens, and the gap decreases when there is less volatility. To understand a stock’s price range, traders use Bollinger bands.
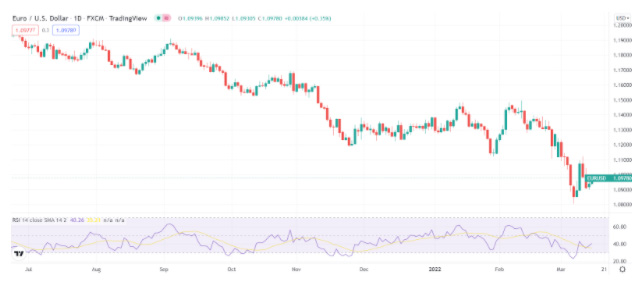
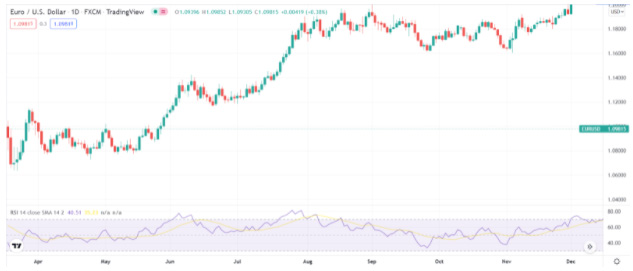
Relative strength index (RSI)
An indicator of momentum is the Relative Strength Index (RSI). An excess of buy or excess sell in the market is indicated by a single line ranging from 0 to 100.
An overbought market indicates a reading above 70, and an oversold market indicates one below 30. A value above 50 indicates an uptrend in the market, whereas a value below 50 indicates a downward trend.
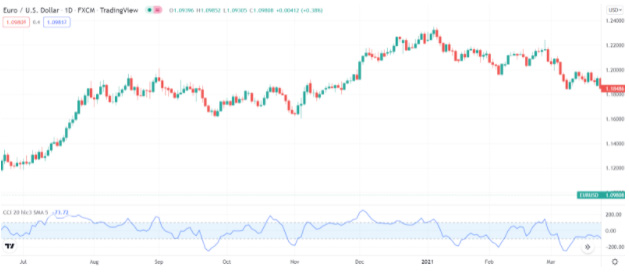
Commodity channel index
To identify new trends in the market, the Commodity Channel Index is accessible. Each value is a zero, a plus, or a minus. A positive CCI indicates an upward trend; a negative CCI indicates an upward trend. The CCI is used with RSI to determine whether stocks are overbought or oversold.
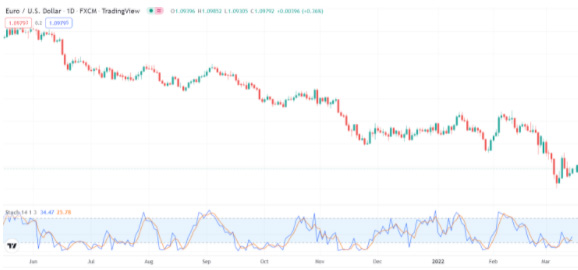
Stochastic oscillator
Indicators of momentum include stochastic oscillators. Oscillators are available to compare closing prices of stocks over time to a range of prices.
Hence, momentum is an indicator that is useful because it reacts to price changes before it does to the momentum.
Using Multiple Indicators
By comparing multiple indicators for day trading, you remove the bias associated with using one indicator.
There are weaknesses to each indicator. For example, you may miss specific price trends if you only monitor the market with one indicator. You might also encounter many false signals.
You can minimize the risk of fake signals and sudden stops by combining multiple indicators into a single trading strategy. The use of various indicators to trade does, however, have its drawbacks when they are not available properly.
Indicators used by traders often display the same type of information. It is just as if you were using just one indicator from the same category when you use multiple ones.
Understanding the different types of technical indicators is essential to avoid this. Furthermore, combining various indicators will help you make better decisions.
Which Indicators Do I Use And How
These days after 15 years in the market, I attend to read and “feel” indicators a bit different than in my early career. As I continued to trade, I shifted my focus from focusing on them to better reading the chart and volume.
However, since literally every trader and algo uses them, it is essential for me to do the same because more eyes/algos using them simply means more collusion points (support/resistance).
In order to choose the right indicator for you, you need to ask yourself what will be his purpose. Are you looking for an indicator that will tell you when to buy or sell? (if so, stop. it won’t work), are you using it to confirm or strengthen your decision to enter/exit a trade or help you to get a better understanding of the momentum and the side who is controlling the stock right now.
For me, the answer is giving myself another V in my checklist of why to get in a trade.
I mostly use an Exponential moving average of 20,50,200 on all time frames, especially on a 1 min and a 1H. I use VWAP in 1 min and MACD in 1 min and 1H.
The EMA’s and Vwap will help me identify a support or resistance level and understand if the price should hold after a pullback. The MACD will be a great assistance for a counter-trend strategy to understand if momentum is shifting by finding divergence between the MACD and price action.
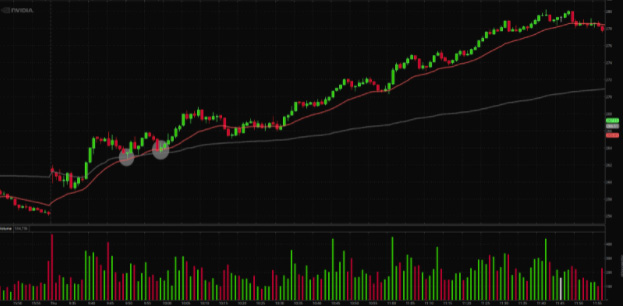
Here are some examples:
NVDA – 20EMA and VWAP acting as support levels after a pullback.
Perfect place to enter.
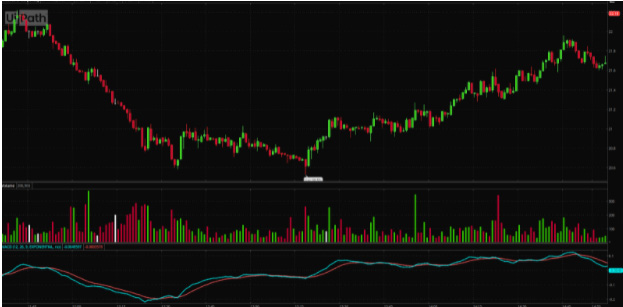
PATH – MACD and chart price showing divergence. Indicate momentum shifting from sellers to buyers.
Best Technical Indicators for Day Trading Stocks Summary
As mentioned, using indicators can help to be a better analyst. In many cases, it can give you an insight into the next move in a stock.
However, always remember that price and volume is the key to really understanding stock behavior. Therefore, use them as an extra tool and not as the main tool, and no matter what, don’t fall into the trap that there is a holy grail.
If you liked this post make sure to share it!