Day trading can be a lucrative venture if you do it properly. Newbies, especially those who don’t have a well-planned strategy, would find day trading challenging. Even the most seasoned day traders sometimes hit rough patches and bare some losses. So, to be a successful day trader, you need to carry out technical analysis and have a high degree of self-discipline and objectivity. Understanding Candlestick patterns for day trading can help. Using the Candlestick patterns can help you better practice purchasing and selling assets within a single trading day.
The Japanese candlestick analytic tool is powerful, offering a glimmer into the psychology of short-term trading activity. This tool can be more helpful when combined with other technical and analytic tools.
This article will help you understand why you should start using the candlestick pattern for day trading. We will also be discussing some of the most powerful candlestick patterns and help you understand how to use them the right way. As you read this article, please take note of any information that resonates with you and try it out.
The history of the Candlestick patterns for day trading
So, how did the idea of using Candlestick patterns for day trading become a thing in the first place? It all started in the 18th century by Munehisa Homma. Homma was a wealthy businessman from Japan. Homma ventured into rice stock trading locally in 1750. Today, the same technical analysis Homma developed is called the Candlestick chart.
Homma’s research on price pattern recognition in trading was such a success that he’s regarded as the Grandfather of Candlestick. Homma is credited with giving rise to a research technique that became the basis for trading in Japan and globally. He used the same price data as bar charts (open, close, high, low) in his chart. However, candlesticks are drawn differently, typically resembling a candle with wicks on both ends – an upper wick and a lower wick.
The low and high are described as shadows and plotted as a single line.
Understanding how to read candlestick charts for day trading is fairly simple. The price range between the closing and opening is plotted as a rectangle on a single line. If the close of the trading day is above the open on the chart, then the body of the rectangle will be white. Similarly, if the close of the trading day is below the open on the chart, then the body of the rectangle will be red.
As in Homma’s chart, the red indicator represents blood, where he references the battle between the buyers and the sellers, which is analog to wars waged in ancient Japanese times. The red indicator can also refer to the war between bears and bulls in the Western world. When the bears are winning the war, sometimes we hear analysts talk about blood on the street. Candlestick charts were introduced to the western world by Steve Nison in his book Japanese Candlestick Charting Techniques.
Why do we use the Candlestick patterns for day trading?
Even the most skillful day trader makes better trading decisions when chart reading. But of all the types of chart reading you can use, why should you use the candlestick pattern for day trading?
Below are the five reasons day traders should use candlestick pattern charts:
Easy to understand
Of the various types of charts day traders use, the candlestick pattern chart remains one of the easiest to understand. Candlestick pattern charts are aesthetically pleasing to look at with customizable options. You can change the color and design of the Candles on the chart however you like.
Provides lots of information
Another reason day traders use the Candlestick chart is that it provides useful information about the market. It displays the high, low, close, and open of a given timeframe. Moreover, they are the most accurate and pure form of chat that displays the data attractive yet easy to understand.
Works with most indicators
Unlike other trading charts that work with particular indicators, the Candlestick chart works with most indicators. So, if indicators are relevant to the trading system you want to use, the Candlestick chart is the best fit.
Useful in creating trading algorithms
The Japanese candlestick pattern is useful in creating trading algorithms because they are easy, simple, and clear to describe. For this reason, programmers will not find it hard to describe the code of trading algorithms that uses technical analysis.
Sentiment and market psychology
The Japanese Candlestick Chart is also useful when looking for who controls the market or market sentiment over a given period. Through several candlestick patterns and formations, such as the Doji pattern, traders can assess what the overall bias can likely be over a period.
What types of Candlestick patterns/reversal patterns are there?
Did you know that there are more than 60 candlestick patterns? Each candlestick pattern comes in different sizes and shapes, representing an aggregation of all the prices traded for a given period. However, it is worth noting that the candlestick pattern is divided into three main types: continuous, bearish, and bullish.
With that in mind, here are 35 Candlestick patterns/reversal patterns every trader should know.
Continuation Patterns
The underlying idea of continuation candlestick patterns is that the odds that a trend will likely continue in the same direction are higher than a reversal. There are different continuation candlestick patterns, but here are the top 10 every trader should know.
Doji
The Doji pattern is a candlestick pattern formed when the closing and opening prices are the same. The Doji pattern forms when both bears and bulls fight to control prices, whereas nobody succeeds in gaining full control of the price. The candlestick pattern looks like a cross with a long shadow and a very small real body in a Doji pattern.
Spinning top
A spinning top is a continuation candlestick pattern similar to the Doji pattern, which indicates the market’s indecision. The main difference between Doji and Spinning top patterns is in their formation. The real body of the spinning top pattern is much larger than a Doji pattern.
Falling three methods
The falling three methods pattern is a continuation pattern that signals an interruption but not a reversal of an ongoing downtrend. The candlestick pattern of a falling three method has two long candles in the trend direction.
Rising three methods
The rising three methods pattern is similar to the falling three method pattern. It is a pattern signal that interrupts but does not reverse the ongoing uptrend. The rising three methods comprise two long candlesticks that move toward the trend.
Upside Tasuki gap
This continuation pattern is formed with three candlesticks due to an ongoing uptrend. The first candle is a long-bodied bullish candle. The second candle is also a bullish candlestick, forming after a gap. The third candle is a type of bearish candle formed between the first two bullish candles and closes in the gap.
Downside Tasuki gap
This pattern is more like the reverse of the upside. It is a type of continuation pattern that is formed in an ongoing downtrend. This downside Tasuki gap candle pattern is created with three candles. A long body bearish candle indicates the first candle. The second candle is a bearish candle formed after a gap down. And the third candle is a bullish candle that closes in the gap formed between the first two bearish candles.
Mat hold
The mat hold is a continuation pattern formation that indicates the continuation of a prior trend. A mat hold pattern can either be bullish or bearish. For example, in a bullish mat hold pattern, the pattern must begin with a large bullish candle followed by a gap higher and three smaller candles that move lower. The fifth candle is usually larger, and it moves to the upside.
Rising window
The rising window pattern indicates the strength of buyers in the market. It consists of two bullish candlesticks with a gap between them. The gap occurs due to a space between the high and low of the two bullish candlesticks due to high trading volatility.
Falling window
The falling window pattern indicates the strength of sellers in the market. Unlike the rising window candlestick pattern, the falling window candlestick consists of two bearish candlesticks with a gap between them. The gap occurs due to a space between the high and low of the two bearish candles due to high trading volatility.
High wave
The high wave continuation pattern is an indecision pattern that shows that a market is either bearish or bullish. This pattern often occurs at resistance or support levels. The candlesticks in this pattern have smaller bodies and long wicks, and they have smaller bodies. But the close price ultimately ends up closing near the opening price.
Bearish Reversal Patterns
Another major type of candlestick pattern is the bearish reversal pattern. The bearish reversal pattern indicates that the ongoing uptrend will reverse to a downtrend. In other words, the traders should be cautious about their long positions when the bearish reversal pattern is formed. Some bearish reversal candlestick charts patterns include:
Hanging man
Hanging man is a pattern formed at the end of a signal and uptrend bearish reversal. The body of this pattern is small and located at the top with a lower shadow, which should be twice the real body. The hanging man pattern has little to no upper shadow. This pattern is formed when the price opens and sellers push down the prices. But then sellers came into the market to push the price but were unsuccessful as the price closed below the opening price.
Dark cloud cover
Dark cloud cover is a bearish candlestick pattern formed after the uptrend indicating a bearish reversal. Two candles from the dark cloud cover: the first candle is bullish, which indicates the continuation of the uptrend. And the second candle is bearish, which opens gaps but closes more than 50% of the previous candle’s body.
Bearish engulfing
The bearish engulfing pattern is a type of bearish reversal formed after an uptrend. It is formed by two candles, where the second candle engulfs the first one. In this pattern, the first candle is a bullish candle indicating a continuation of the uptrend, while the second candle is a long bearish candle that shows the bears are back in the market.
The evening star
The evening star candlestick pattern is a pattern formed after the uptrend indicating a bearish reversal. This pattern consists of three candlesticks; the first is a bullish candle that indicates the continuation of the uptrend, the second is a Doji candle that indicates the indecision in the market, and the third is a bearish candle that shows the bears are back in the market.
Three black crows
The three black crows is a bearish pattern formed after an uptrend. These candlesticks are made of three long bearish bodies, but it does not have long shadows, and it opens within the real body of the previous candle in the pattern.
Black marubozu
The black marubozu is a type of bearish single candle formed after an uptrend. This candlestick had a long bearish body with no lower and upper shadows. This pattern shows that the bears exert selling pressure, and the market may turn bearish.
Three inside down
The Three Inside Down is bearish multiple candlestick patterns. It formed after an uptrend indicating a bearish reversal. As the name suggests, it consists of three candlesticks; the first is a long bullish candle, the second is a small bearish candle, and the third is a long bearish candle confirming the bearish reversal.
Bearish harami
The bearish harami is a type of bearish pattern formed after the uptrend. Also, the bearish harami consists of two candlesticks; the first is a tall bullish candle that shows the continuation of the bullish trend. The second is a small bearish candle that shows the bears are back on the market.
Shooting star
The shooting star is a bearish pattern. It is formed at the end of the uptrend, which gives a bearish reversal signal. In this candlestick pattern, the body is at the end, and there is a long upper shadow.
The shooting star pattern is the inverse of the Hanging Man Candlestick pattern. This pattern is formed when the closing and opening prices are near each other, and the upper shadow is more than twice the body.
Tweezer top
The tweezer top is a bearish reversal candlestick pattern. It is formed at the end of an uptrend. A tweezer top pattern is formed by two candlesticks, the first being a bullish candle and the second being a bearish candle. Both candlesticks in this pattern make almost the same high. The tweezer top pattern is formed when the prior trend is an uptrend.
Three outside down
The three outside down is a bearish pattern formed with multiple candles after an uptrend. There are three candlesticks in a three outside down pattern; the first is a short bullish candle, the second is a large bearish candle, and the third is a long bearish candle confirming the bearish reversal.
Bearish counterattack
This is a bearish pattern that shows when the market is experiencing an uptrend. This pattern predicts the current uptrend in the market and the new downtrend it will take over the market.
Bullish reversal patterns
Any bullish reversal pattern indicates that the ongoing downtrend will reverse to an uptrend. Day traders should be cautious of these short positions when the short positions, especially when the bullish reversal patterns are formed. Below are some types of bullish reversal patterns everyday traders ought to know.
Hammer
The hammer is a single bullish candlestick pattern formed at the end of a downtrend. The body of this pattern is small and located at the top with a lower shadow. The hammer candlestick has no or little upper shadow. This pattern is formed due to prices opening and sellers pushing down the prices. But the sellers came into the market again to push the prices up and closed the trading session more than the opening price.
Piercing pattern
The piercing pattern is bullish multiple candlestick patterns formed after a downtrend. The piercing pattern is formed by two candlesticks, the first being a bearish candle during the second a bullish candle. The second candle opens a gap down but closes more than 50% of the real body of the previous candle. The piercing pattern indicates that the bulls are in the market.
Bullish engulfing
The bullish engulfing pattern is a multiple stick chart pattern formed after a downtrend. The bullish engulfing pattern is formed by two candles, where the first candle engulfs the second candle. Also, the first candle is a bearish candle that indicates the continuation of the downtrend, while the second candle is a long bullish candlestick engulfing the first candle. This chart pattern indicates that the bulls are back in the market.
The morning star
The morning star is a bullish multiple candlestick chart pattern formed after a downtrend. This candlestick is made of three candlesticks; the first is a bearish candle that continues the downtrend, the second is a Doji that indicates indecision in the market, and the third is a bullish candle that indicates the bulls are back in the market.
Three white soldiers
The three white soldiers are bullish multiple candlestick patterns formed after a downtrend. This pattern is formed with three long bullish candles that don’t have long shadows but are open within the previous candle’s body in the pattern.
White marubozu
The white marubozu is a bullish signal candlestick pattern that is formed after a downtrend. This candlestick pattern has a long bullish body with no upper or lower shadow. The lack of an upper or lower shadow indicates that the bulls exert buying pressure, and the market may become bullish.
Three inside up
The three inside up are multiple candlestick patterns formed after a downtrend. It is formed with three candlesticks: a long bearish candle, the second a small bearish candle, and the third a long bearish candle. The first and second candlestick relationship is a bullish harami candlestick pattern.
Bullish harami
This bearish pattern is a multiple candle pattern formed after a downtrend. The bullish harami consists of two candlestick charts; the first candlestick is a tall bearish candlestick that shows the continuation of the downtrend, while the second candlestick is a bullish candle that indicates the bulls are back in the market.
How to use them the right way?
Irrespective of how you trade, you should never buy, sell or short a stock based only on one parameter. Any good day trader will tell you that you need at least four elements combined to decide and execute a trader with better odds of making a profit. A candlestick pattern can be one of those parameters, but you must get more conviction to get in that trade. You could be a major support level mixed with a bullish reversal pattern at the end of a downtrend when the market pushes higher.
New traders commonly mistake finding an ideal reversal pattern form but forget to look out for its location. Such traders may see a bullish reversal candle as a hammer candlestick and buy that stock. However, the issue with this candlestick is that the hammer is not located at a reversal point.
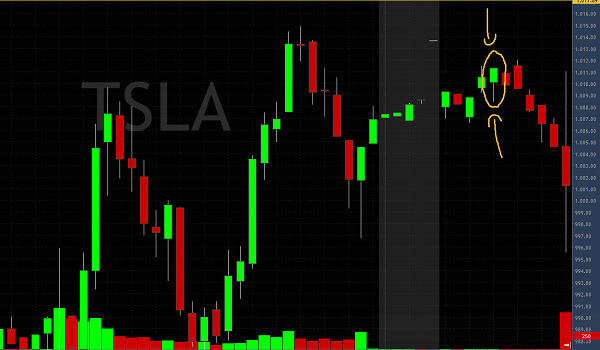
Take the example below; TSLA adds a perfect hammer formation candle (marked in the circle), but the hammer candle is a bullish reversal candle. You can expect the trend to reverse from the chart, but if we are already in an uptrend, the hammer is irrelevant because it should be located at the bottom of a downtrend/move.
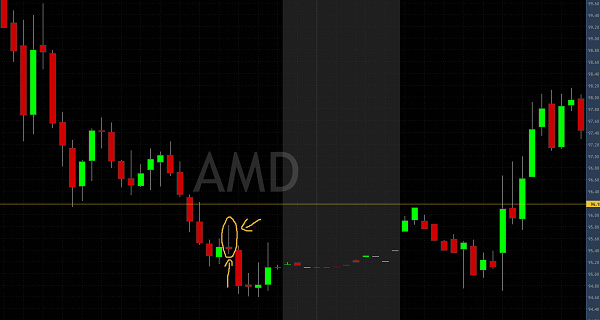
Also, the chart below shows a great shooting star reversal formation, which should indicate the beginning of a downtrend. However, the candle is already downtrend, meaning it is not at the top of a move where it is supposed to reverse the trend (from up to down).
Candlestick Patterns Conclusion
Analysis from candlestick is a popular and effective way to analyze charts for novice and experienced day traders. If you can spot confirmation, reversal, or indecision patterns, then you know when a trend is just slowing down or is over. Using candlestick patterns will help make better trading decisions with a more precise exit and entry strategy.
If you liked this post make sure to share it!