Introduction
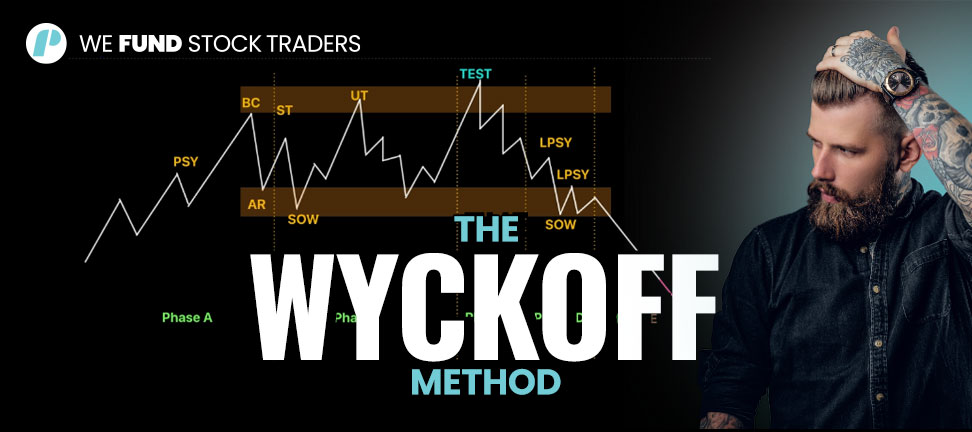
The Wyckoff method is a technical analysis tool developed by Richard Wyckoff in the early 1900s. It is based on the idea that the accumulation and distribution of stocks by large institutions (Smart Money) can be identified through price action and volume analysis. The Wyckoff Method may seem complex at first but becoming familiar with it can be very beneficial for traders as it can be a powerful tool for identifying potential trading opportunities.
In today’s article, we will take a simplified look at the Wyckoff Method as a whole, including:
- The basics of the Wyckoff Method,
- How to identify each phase of Wyckoff Accumulation and Distribution.
- How to trade the Wyckoff Method.
The Basics of the Wyckoff Method
When creating it, Richard Wyckoff based his technical trading method on three basic principles::
The law of supply and demand
The price of a stock is determined by the interaction of supply and demand.
When supply exceeds demand, the price will fall. When demand exceeds supply, the price will rise.
The law of cause and effect
Every price movement is caused by an underlying force.
The Wyckoff Distribution identifies the cause of price movements by studying the relationship between price and volume.
The law of effort and result
The amount of effort required to move a stock price is proportional to the amount of result that will be achieved.
The Wyckoff Distribution uses price and volume analysis to identify the amount of effort that is being put into moving a stock price and predict the result on price action.
How to Identify each Wyckoff accumulation and distribution phase
Now that we know the principles The Wyckoff Distribution is based upon, it’s time to find out how to recognize it on our charts and identify the current phase a stock is in.
Let’s start by saying that the Wyckoff Distribution is formed by four phases taking place during the accumulation as well as the distribution.
Each phase is characterized by a series of specific price and volume patterns. It is by analyzing price and volume that traders are able to identify the current phase of a stock’s price cycle.
Accumulation Phases
A. Accumulation (Phase A): This is the initial phase where smart money or institutional investors start accumulating shares at low prices. This phase is characterized by decreased trading volume and a price range tightening.
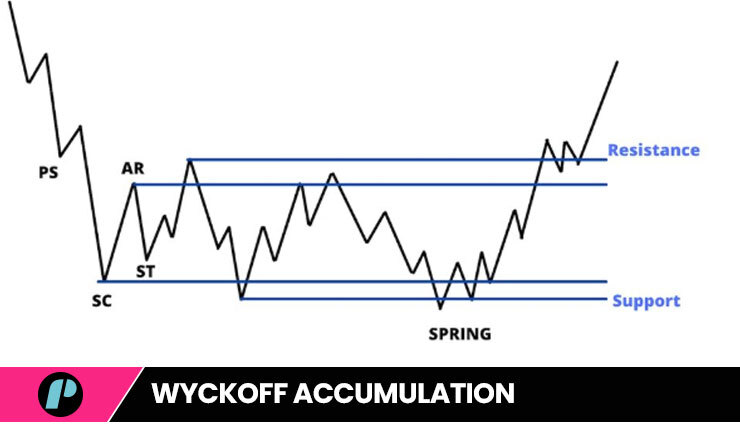
B. Markup (Phase B): During this phase, the price starts to increase as demand exceeds supply. This phase is marked by increasing volume and a break above the trading range in Phase A.
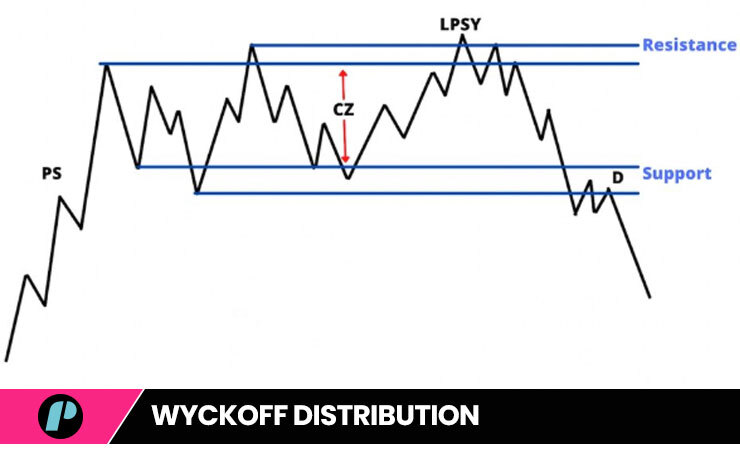
Distribution Phases
C. Distribution (Phase C): In this phase, smart money begins selling their accumulated shares to the public as the price reaches its peak. Volume increases during this phase, and the price movement tends to trade in a range.
D. Markdown (Phase D): This is when the price starts to decline as supply overtakes demand. This phase is marked by decreasing prices and volume.
E. Reaccumulation (Phase E): In this final phase, the price stabilizes, and a new accumulation phase may begin, setting the stage for a potential new uptrend.
How to Trade the Wyckoff Method
There are several trading strategies based on the Wyckoff Distribution and, for the scope of this article, we’ll take a look at one for each of the three distribution phases.
Strategy 1: Accumulation Phase
Price has sharply declined and is now consolidating within a narrow range, forming a “spring” or ” rectangle” pattern.
Actions:
- Identify the accumulation range and its upper and lower boundaries.
- Wait for price to break out above the upper boundary with significant volume.
- Enter a long position with a stop-loss below the range low.
Strategy Rationale:
Wyckoff’s accumulation phase indicates that smart money is entering the market at low prices. The breakout above the range high confirms that the accumulation process is complete and that the trend is turning bullish. The stop-loss below the range low protects against a false breakout or a reversal of the trend.
Strategy 2: Distribution Phase
Price has risen sharply and is now consolidating within a narrow range, forming a “top” or “triangle” pattern.
Actions:
- Identify the distribution range and its upper and lower boundaries.
- Wait for price to break out below the lower boundary with significant volume.
- Enter a short position with a stop-loss above the range high.
Strategy Rationale:
Wyckoff’s distribution phase indicates that smart money is selling off its positions at inflated prices. The breakout below the range low confirms that the distribution process is complete and that the trend is turning bearish. Here, too, the stop-loss above the range high protects against a false breakout or a reversal of the trend.

Strategy3: Neutral Zone
Price has consolidated within a neutral zone, characterized by a lack of clear direction or trend.
Actions:
- Identify the neutral zone and its boundaries.
- Wait for price to break out either above or below the neutral zone with significant volume.
- Enter a trade in the direction of the breakout with a stop-loss within the neutral zone.
StrategyRationale:
Wyckoff’s neutral zone represents a period of uncertainty in the market. The breakout from the neutral zone provides a clear indication of the direction of the next move. Yet again, the stop-loss within the neutral zone protects against a false breakout or consolidation within the zone.
Conclusion
The Wyckoff Distribution is a complex and nuanced method, but it can be a powerful tool for identifying potential trading opportunities. By understanding the basics of the Wyckoff Distribution and how to identify and trade its patterns, you can improve your chances of success in the financial markets by adding another great trading tool to your arsenal.
I hope this helps.
If you liked this post make sure to share it!