Introduction
As anyone who has ever traded knows, technical indicators are tools that assist traders in analyzing and making decisions about market trends and potential price movements. Nowadays, there are literally thousands of different indicators out there. They come in all shapes and forms, analyze different aspects of asset trends and, for the vast majority, are free and easy to obtain. One could say “Traders have never had it easier”. However, despite the huge number of readily available technical indicators, there are a few that seem to be more popular than others and part of most traders’ strategies (at least in some measure). Two such indicators are the RSI (Relative Strength Index) and the MACD (Moving Average Convergence Divergence).
In this three-part article, we’ll start by taking a schematic view of each of the two indicators to better understand their characteristics, their uses, and the differences between them. This will also give everyone the chance to identify the best suited to his or her strategy.
In the second and third articles, we’ll then dive together right into the most popular trading strategies based on both the RSI and those based on the MACD so that once you know which one is your favorite, you’ll also know how to use it in the best way.
Interested?
Thought so.
The RSI and the MACD
The RSI and the MACD are two of the most widely recognized indicators and they are often used in conjunction as each serves a different function and provides its unique insight into market behavior.
Understanding the differences, applications, and advantages of RSI and MACD can further improve your decision-making, your strategy, and your trading, and who wouldn’t want that?
Key Notes
- The RSI indicator moves on a 0-100 scale.
- Values above 70 indicates the stock might be overbought and the bullish price trend my reverse.
- Values below 30 indicates the stock might be oversold and the bearish trend might reverse.
- RSI divergences are also seen as precursor to price reversals.
- RSI is calculated by averaging gains and losses and it’s particularly suitable for range-bounds markets.
What is the RSI?
The relative strength index (RSI) measures the momentum by assessing the speed and magnitude of price movements, allowing traders to evaluate whether an asset is overvalued or undervalued. The RSI helps identify potential buying or selling opportunities based on the relative strength of the asset’s price movements.
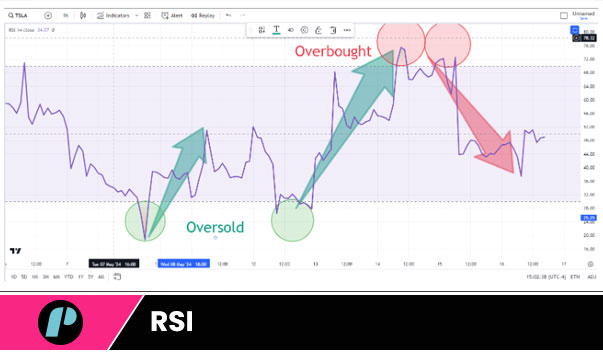
Overbought and Oversold Conditions
The RSI indicator oscillates on a scale between 0 and 100 and, traditionally, any value higher than 70 is interpreted as a signal that the asset is overbought. Conversely, when the RSI value falls below 30, it suggests that the asset may be oversold instead. These specific thresholds are valuable indicators for traders as they can help predict potential reversals or continuations in market trends.
RSI Divergence Indicator
Another way that the RSI can be analysed and used is as a divergence indicator divergence which can also indicate the potential for reversals.
For example, if the price of an asset is reaching new highs, but the RSI fails to surpass its previous high, the bearish RSI Divergence created works as a warning to traders for a potential price reversal. On the other hand, if the price reaches new lows while the RSI remains high, the divergence could signal that price could soon start moving upwards.
(More on “What is the RSI?”, “Overbought/Oversold signals”, and on “The RSI Divergence Indicator” coming up in the next article – 2/3).
Key Notes
- The MACD indicators follows trends and measure momentum.
- The MACD indicator is calculated by subtracting the 26-period Exponential Moving Average (EMA) from the 12-period EMA.
- The MACD is used to identify changes in the strength, direction, momentum, and duration of a trend and it’s best suited for trending markets.
What is the MACD
The MACD is an indicator that follows trends and measures the momentum of an asset’s price by comparing two different moving averages. It is calculated by subtracting the 26-period Exponential Moving Average (EMA) from the 12-period EMA, resulting in the MACD line. Additionally, a 9-day EMA of the MACD, known as the signal line, is plotted on top of the MACD line. This signal line can act as a trigger for buying and selling signals.
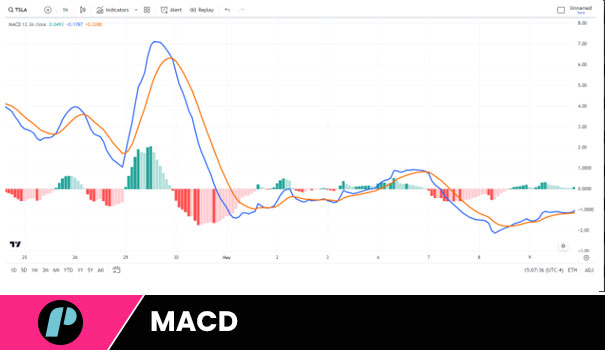
Histogram
The MACD histogram visually represents the difference between the MACD line and the signal line. It provides a clear depiction of the momentum of price movements.
Crossovers
Crossovers occur when the MACD line intersects with the signal line. When the MACD line crosses above the signal line, it is considered a bullish signal, indicating that it may be a good time to buy. Conversely, when the MACD line crosses below the signal line, it is typically seen as a bearish signal, suggesting that it might be time to sell.
(More on the “MACD Histogram”, “MACD Crossovers”, and MACD signals interpretation in the article 3/3 on RSI and MACD)
RSI Vs MACD
RSI and MACD are both momentum indicators that traders use to assess market conditions. However, they have distinct purposes and provide different information.
RSI Vs MACD – Purpose and Usage
RSI: The primary purpose of RSI is to identify overbought or oversold conditions in the market. It helps traders determine if the current price trend is likely to experience a correction or reversal. RSI is particularly valuable in range-bound markets where prices fluctuate between support and resistance levels.
MACD: On the other hand, the MACD is used to identify changes in the strength, direction, momentum, and duration of a trend. It is especially useful in trending markets where the objective is to ride the trend for its entire duration.

RSI Vs MACD – Components and Calculation
RSI: RSI is calculated by averaging gains and losses over a specified period, typically 14 days. The result is a single value that oscillates between 0 and 100.
MACD: MACD involves the calculation of two exponential moving averages (EMAs) and the difference between them. It provides multiple components for analysis, including the MACD line, signal line, and histogram.
RSI Vs MACD – Type of Markets
RSI: Most suitable for markets that are range-bound. RSI performs well in situations where the price fluctuates within a horizontal trading range, as it assists traders in identifying points of reversal.
MACD: Ideal for markets that are trending. MACD is advantageous in markets where prices are consistently moving in a particular direction, either upward or downward, as it helps traders capture the ongoing momentum.
RSI Vs MACD – Potential Drawbacks
RSI: One of the main disadvantages of RSI is that it can produce false signals during strong trending markets. For instance, in a strong uptrend, RSI may remain in the overbought range for an extended period, causing traders to prematurely anticipate a reversal.
MACD: The MACD can sometimes lag behind real-time price movements because it relies on historical data. This lag can result in delayed signals, potentially causing traders to miss out on optimal entry or exit points.
Combining RSI and MACD
Although RSI and MACD are two separate indicators, their combined use can lead to a more accurate and comprehensive technical analysis. Here’s how it works:
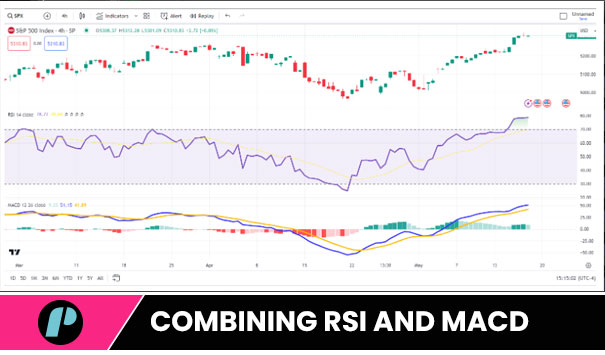
Signal Confirmation: When both RSI and MACD generate the same signal, it provides traders with an increased level of confidence in their decision-making. For example, if RSI indicates that an asset is overbought and MACD triggers a bearish crossover, the combined signal suggests a stronger case for considering a potential sell.
Noise Filtering: The combination of RSI and MACD helps filter out false signals. If RSI indicates an overbought condition but MACD does not show any signs of bearish momentum, traders may choose to exercise caution and refrain from making impulsive decisions.
Identification of Divergences: Both RSI and MACD are effective in identifying divergences. When both indicators show divergence from the price action, it strongly indicates a potential trend reversal.
By utilizing the combined power of RSI and MACD, traders can make more informed and confident trading decisions while minimizing the impact of false signals and identifying potential trend reversals.
Conclusion
RSI and MACD are two valuable instruments for technical traders.
The RSI is particularly effective in identifying instances where the market is either overbought or oversold in range-bound conditions. The MACD, on the other hand, is most useful in trending markets as it highlights changes in momentum and trends. By comprehending the distinct qualities of these tools and skillfully combining them, traders can gain a more comprehensive understanding of market dynamics and enhance their decision-making process.
Ultimately, successful trading relies on utilizing a diverse range of indicators and continuously refining one’s strategy based on market conditions and performance analysis so don’t stop learning and don’t stop trading!
Hope this helps.
If you liked this post make sure to share it!