Introduction
In our past article “Which is better for stock trading, THE RSI or THE MACD?”, we learned that the RSI indicator is a momentum oscillator used by traders to assess and predict price movements. We also learned that it measures recent price fluctuations to determine whether a stock is overbought (RSI > 70) or oversold (RSI < 30).
What we haven’t talked about, however, is how traders use the RSI indicator in the stock market as part of their strategy… but that’s only because RSI trading strategies are the topic of today’s article.
Ready?
Let’s dive in!
The 6 most popular RSI-based Trading Strategies
As for all technical indicators, the RSI can be used in many different ways and each trader has his favorite. Traditionally, the RSI is used as an entry indicator or a confirmation indicator but often traders use it as an exit indicator too. By getting familiar with it and practicing, you’ll be able to decide if and how it best fits your trading strategy and style.
To help get you started, we collected the 6 most popular and effective stock trading strategies based on the RSI indicator.
Here they are:
-
Basic RSI Buy/Sell Trading Strategy
This simple strategy involves purchasing stocks when the RSI falls below a specific threshold, typically 30, indicating an oversold condition. Conversely, it suggests selling stocks when the RSI surpasses a certain threshold, commonly 70, indicating an overbought condition.
Execution:
Buy Signal: Buy when the RSI drops below 30. (It signifies that the stock is potentially oversold, and there may be an upcoming price increase).
Sell Signal: Sell when the RSI exceeds 70. (It indicates that the stock is potentially overbought, and price might start decreasing soon).
Example: Suppose stock XY’s RSI declines to 28; this could be an opportune time to buy if confirmed by other indicators. Conversely, if Stock AMZN’s RSI rises to 72, it may be a good time to consider selling.
-
RSI Divergence Trading Strategy
RSI divergence occurs when there is a contrasting movement between the RSI and the stock price. This can potentially signify a reversal in the trend.
Execution:
Bullish Divergence: This happens when the stock price reaches a new low while the RSI forms a higher low. This suggests that the selling pressure is diminishing, and there may be a forthcoming bullish reversal.
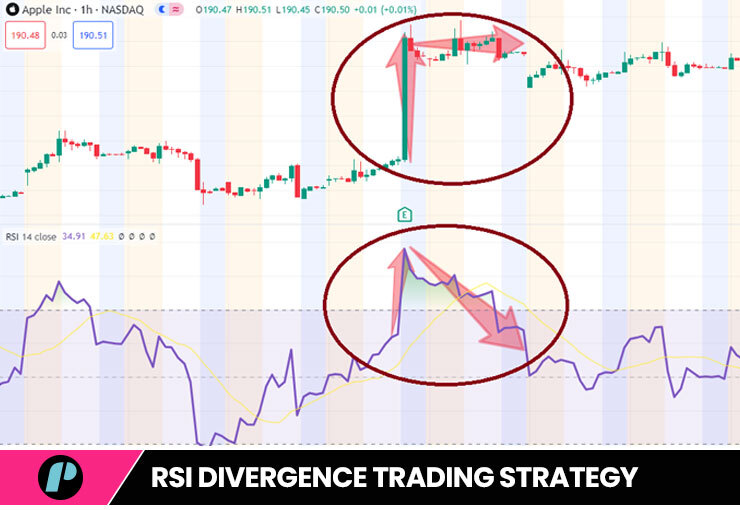
Bearish Divergence: This occurs when the stock price reaches a new high, but the RSI forms a lower high. This indicates that the buying momentum is weakening, and there might be a bearish reversal approaching.
Example: For instance, stock XY’s price hits a new low, but the RSI does not follow suit and instead forms a higher low, this could indicate that the stock is likely to undergo a bullish reversal.
-
Swing Rejection Trading Strategy.
The RSI Swing Rejection Strategy is a method that combines RSI levels with specific rejection patterns to identify possible price reversals. It relies on the concept of “failure swings” to validate the signals of a reversal.
Execution:
There are two types of swing rejections: bullish and bearish.
Bullish Swing Rejection Pattern: this pattern occurs when:
- the RSI goes into oversold territory (below 30)
- the RSI crosses back above 30
- the RSI forms another lower low without crossing back into the oversold territory, and, finally
- the RSI rises and breaks its recent high
This bullish swing rejection pattern is seen by traders as strong signal of a potentially imminent bullish price move.
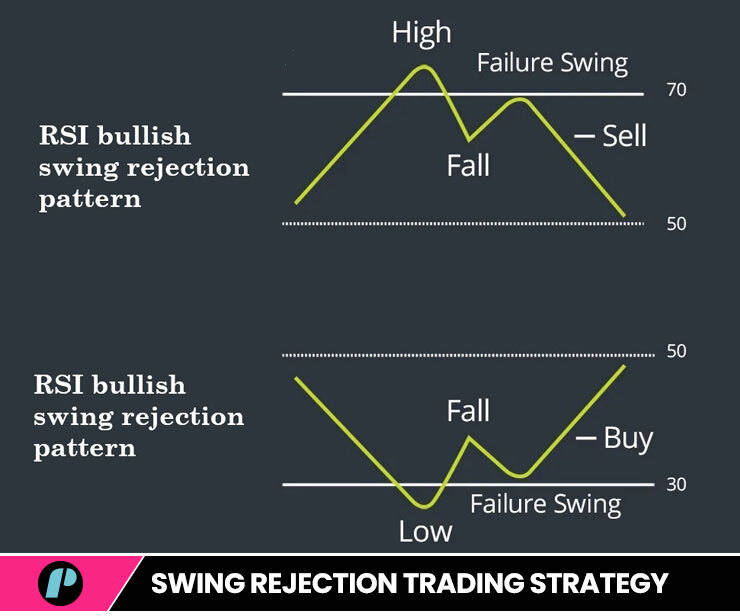
Bearish Swing Rejection Pattern: contrary to its bullish counterpart, a bearish swing rejection occurs when:
- the RSI goes into overbought territory (above 70)
- The RSI crosses back below 70
- the RSI forms another higher high without crossing back into the overbought territory and, lastly
- the RSI breaks its recent low
Where a bullish swing rejection pattern is seen as a sign of possible bullish move in price, it’s only natural that a bearish swing rejection pattern would signal traders to prepare for a potential downtrend instead.
Example: let’s consider any stock XY If its RSI drops below 30 and then rises above 30, followed by forming a higher low while the RSI remains above 30, and finally breaks its recent high, it indicates a potential bullish swing rejection.
-
RSI with Moving Average Crossover Trading Strategy
This technique integrates the Relative Strength Index (RSI) with moving average (MA) crossovers to generate more reliable trading signals.
Execution:
Apply a short-term moving average (e.g., 10-day) alongside a longer-term moving average (e.g., 50-day).
Buy Signal: When the RSI surpasses 30 and the short-term MA rises above the long-term MA, this indicates a potential upward trend.
Sell Signal: When the RSI dips below 70 and the short-term MA falls below the long-term MA, this signifies a possible downward trend.
Example: Consider Stock XY, where the RSI climbs above 30 while the 10-day MA simultaneously moves above the 50-day MA. This could be interpreted as a strong buy signal. On the other hand, if the RSI drops below 70 and the 10-day MA sinks beneath the 50-day MA, it may suggest that it’s time to sell.
-
RSI Trendline Trading Strategy
This method entails drawing trendlines on the Relative Strength Index (RSI) to detect possible breakouts that correspond with price fluctuations.
Execution:
Recognize a trend by sketching a trendline on the RSI, such as linking the peaks or troughs of the RSI.
A breakout from this RSI trendline may signal a potential shift in the price direction.Example: For instance, if Stock XY’s RSI downtrend line is surpassed as the RSI moves upward and crosses above the trendline, this could suggest a bullish breakout.
-
Stochastic RSI Trading Strategy
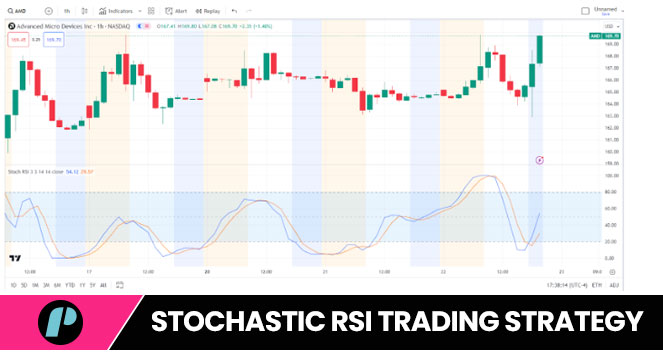
A stochastic RSI strategy combines The RSI with another popular technical indicator – the Stochastic Oscillator. Both the RSI and the Stochastic are oscillators focused on identifying overbought and oversold conditions in the market and some traders like to use them both simultaneously.Execution:
Look for divergence between the two indicators. For example, if the RSI is showing a strong trend but the Stochastic Oscillator indicates overbought conditions, it might signal a potential reversal. Define entry and exit points based on the signals generated by both indicators. For example, entering a trade when the RSI crosses above a certain level and the Stochastic Oscillator confirms the bullish signal.

Conclusion
The RSI indicator serves as an extremely versatile indicator for traders, helping them pinpoint potential entry and exit levels within the market.
The strategies we spoke about – as well as many others – offer valuable insight and perspectives that allow traders to analyze the market in all its varying market conditions.
Get some practice trading with the RSI on your chart and see if it helps to trade better and more efficiently. In the meantime,
I hope this helps.
Watch our hosts Scott and Mitch discuss indicators on our live trading room!
If you liked this post make sure to share it!