Introduction
Every day more and more people around the world choose to educate themselves on the ins and outs of trading and investing in the stock market with the hope of achieving the financial independence we all aspire to. But what is the stock market exactly? What is the difference between trading and investing? And what should I do if I want to become a trader?
Well – you guessed it – this article will try and give an answer to precisely those questions! Let’s start with this Introduction to the Stock Market.
What is the Stock market exactly?
The stock market is the marketplace where individuals and institutions alike can buy and sell ownership shares of publicly traded companies. It is a vital component of the global economy and, within it, serves multiple purposes, for example, it facilitates capital raising for companies and provides investors with opportunities to profit from their success.
The way it works is quite simple to understand:
Companies issue stocks to raise capital which allows them to finance their day-to-day operations and fund growth initiatives. By buying a share of a company’s stock, investors become partial owners and, therefore, have the potential to benefit from the company’s future success.
Think about it; when you buy a share of a Company, you become somewhat of a co-owner of that company!
(Although that won’t necessarily mean you’ll find yourself sitting in an office with Elon Musk or Tim Cook).
The stock market provides investors with a platform to trade these stocks. It operates through various exchanges, such as the New York Stock Exchange or NASDAQ, where buyers and sellers come together to execute transactions. The stock market creates liquidity, allowing investors to easily buy or sell shares on a daily basis.
As for most things, stock prices fluctuate based on supply and demand. If more people want to buy a particular stock, its price typically rises. On the other hand, if more people were to sell stock rather than buy it then its price would tend to decline.
As you might already know, these price changes are influenced by numerous factors, including company performance, economic indicators, news events, and investor sentiment.
Trading and investing
Market investors that profit from stock volatility and price movement are commonly divided into two groups: long-term investors and traders. Let’s continue our introduction to the stock market to learn the difference in depth:
Long-term Investors
Long-term investors aim to profit from their investments through capital appreciation and dividends.
Capital appreciation occurs when the price of a stock increases over time, allowing investors to sell their shares at a higher price than what they paid to buy them.
Dividends are a portion of a company’s profits that are distributed to shareholders on a regular basis (although not all companies pay dividends).
Traders
Traders, on the other hand, employ a strategy of frequent buying and selling of stocks or other assets to capture short-term price movements either when prices rise or fall.
Trading the stock market is probably the most attractive form of investment in the stock market because it requires a smaller capital and it can provide impressive earnings in a much shorter time.

How do traders and investors know what to buy and what not to buy? Or even sell, for that matter!
Traders and investors make most of their investment decisions based on the results of two commonly used methods: fundamental analysis and technical analysis.
Although traders and long-term investors use both fundamental and technical analysis, they often do so in different measures. Generally, long-term investors would find fundamental analysis more useful to predict the long-term potential of a company, whilst short-term traders would find technical analysis as a more accurate indication of the likelihood of any price movement and of its direction.
Want to know what fundamental analysis and technical analysis are? Well, let me tell you.
Fundamental Analysis
Fundamental analysis is one of the methods used to evaluate the intrinsic value of a stock or an entire company. It involves analyzing financial and non-financial factors to determine the underlying value and potential of an investment.
These are some of the key components of fundamental analysis:
- Financial Statements: These include the income statement, balance sheet, and cash flow statement. These documents provide insights into the company’s profitability, debt levels, and cash flow generation.
- Earnings and Revenue: Analysts review a company’s historical and projected earnings and revenue growth. This helps identify trends, potential risks, and the overall financial health of the business.
- Valuation Ratios: Various ratios, such as price-to-earnings (P/E), price-to-sales (P/S), and price-to-book value (P/B), are used to compare a company’s stock price to its financial performance. These ratios provide insights into whether the stock is overvalued or undervalued relative to its peers or historical values.
- Industry and Market Analysis: Fundamental analysts also consider the industry and market in which a company operates. Understanding industry trends, competitive landscape, and macroeconomic factors helps assess the company’s growth potential and market position.
Technical Analysis
The term “technical analysis” refers to the method of trying to predict future price movements in the stock market based on historical data, such as past prices, trading volumes, and chart patterns. Traders and investors do so based on the belief that patterns and trends in the past can provide useful insights into the future direction of stock prices.
Some examples of tools used in technical analysis are:
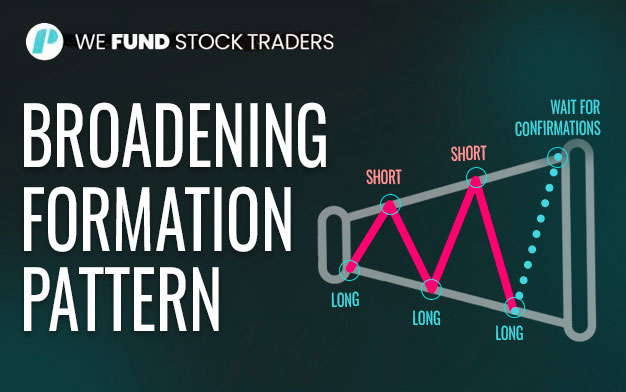
- Price trends: Technical analysts study price charts to identify patterns and trends. Common chart patterns include support and resistance levels, trendlines, and chart formations like triangles, and head and shoulders.
- Indicators: Technical analysts use various indicators to measure price momentum, volatility, and other key factors. Some examples are moving averages, Relative Strength Index (RSI), Moving Average Convergence Divergence (MACD), and Bollinger Bands.
- Support and resistance: These are levels at which stock prices tend to stop falling (support) or rising (resistance). Technical analysts use these levels to identify potential buying or selling opportunities.
- Candlestick patterns: Candlestick charts display price movements with colored bars or candles of different types. Analysts look for specific candlestick patterns that indicate potential trend reversals or continuation.
Learn more about technical analysis and find out how to use some of the technical indicators on our blog!
Introduction to the Stock Market – Final Words
To become a trader in the stock market there is much to be learned and much more to be gained. The first step is to decide to pay the trade the respect, dedication, and commitment that it demands…
…the second step is to join TradeThePool and get some serious capital to start earning from the stock market!
Hope this helps,
Now go get your pips!
If you liked this post make sure to share it!