Prop traders don’t get second chances. A single misread stock rotation cycle — entering energy too late, sizing too large, or exiting on headlines instead of signals — can breach a funded account in one session. In 2026, that risk is real, and the opportunity is equally significant. The S&P 500 Energy Sector surged +36% year-to-date through March 24, driven not by retail momentum but by institutional reallocation out of compressed technology valuations and into real-asset cash flows.
Geopolitical supply disruptions across the Strait of Hormuz, OPEC+ output discipline, and accelerating AI-driven power demand created a structural convergence that informed allocators had mapped since late 2025. This article gives prop traders the exact framework they need: how stock rotation works, which seasonal and macro cycle patterns govern timing, which FIFO, LIFO, and FEFO methods govern entry and exit sequencing, which energy stocks and ETFs lead at each cycle stage, and how to manage position risk within the strict drawdown rules that define funded account survival in 2026.
What Is Stock Rotation? A Prop Trader’s Framework
Stock rotation defines the core discipline of every funded trading program. It is the systematic reallocation of capital from underperforming sectors to outperforming ones as economic cycle conditions shift. For prop traders operating under strict drawdown limits and daily loss rules, rotation timing is not optional; it is the mechanism that determines whether a trading cycle ends in profit or in a breach.
In financial markets, rotation means moving capital from growth sectors into cyclical ones when inflation accelerates, and commodity earnings outpace broader indices. In inventory management, stock rotation means organizing product flow, using systems like First-In, First-Out (FIFO), Last-In, First-Out (LIFO), and First-Expired, First-Out (FEFO), to eliminate waste and optimize turnover. Both disciplines share one master principle: manage the sequence of asset movement with precision and purpose.
In 2026, the S&P 500 Energy Sector delivered +36% year-to-date through March 24. Institutional allocators led the move. Geopolitical supply disruptions across the Strait of Hormuz, OPEC+ output discipline, and AI-driven power demand created a structural convergence. Prop traders who identified the entry in Q4 2025 captured the full institutional accumulation phase, two to four weeks ahead of mainstream coverage.
The Golden Rule of Stock Rotation for Prop Traders
What is the golden rule of stock rotation? Rotate into sectors that are accelerating relative to the benchmark, and out of them before that relative strength begins to deteriorate. For prop traders, this rule has a second clause that retail investors rarely apply: position sizing must reflect the stage of the cycle, not the conviction level alone.
Early-rotation entries warrant larger sizing because institutional accumulation supports the trade. Late-rotation entries into already-rerated names carry higher gap risk and demand smaller sizing under the 1% rule. The golden rule combines direction discipline with size discipline; both are required for consistent funded account performance.
How the Business Cycle and Seasonal Patterns Drive Energy Outperformance
The business cycle moves through four phases: Expansion, Peak, Contraction, and Trough. Energy stocks deliver their strongest outperformance at Peak and into the Contraction phase, when commodity pricing power remains elevated, and energy earnings outpace every other sector. Near the Trough, central bank and fiscal stimulus create a reflationary environment that can extend energy’s outperformance window further. In 2026, that transition arrived ahead of schedule, accelerated by Middle East supply disruptions and OPEC+ production restraint.
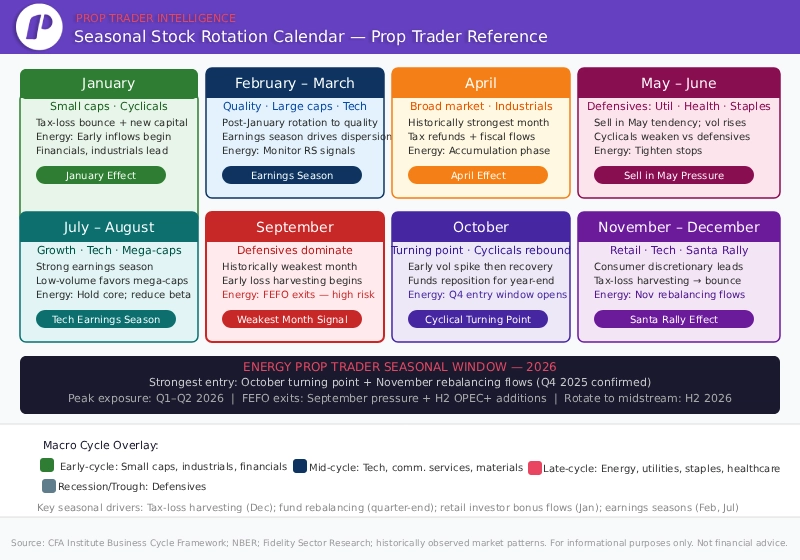
Seasonal rotation patterns reinforce the macro cycle signal. January typically brings new capital deployment into cyclicals, industrials, financials, and energy, as funds rebalance and retail investors deploy year-end bonuses. The April effect historically produces broad market strength. The May-through-June window introduces defensive rotation pressure, utilities, healthcare, and staples. July and August historically favor growth and technology. September, historically the weakest month for equities, triggers early loss harvesting and high-beta underperformance. October marks a cyclical turning point as funds reposition for year-end. November and December bring the Santa Rally effect and consumer discretionary strength.
For energy prop traders, this seasonal map has a direct application. The Q4 2025 entry into energy aligned with the October turning point and November rebalancing flows, two of the most reliable seasonal catalysts for cyclical sector rotation. The Iran–Strait of Hormuz risk premium added an unplanned geopolitical overlay to an already-favorable cyclical and seasonal setup. Prop traders who mapped both the business cycle and the seasonal calendar correctly identified the Q4 2025 entry window two to four weeks before mainstream coverage confirmed the trade.
Seasonal Stock Rotation Calendar — Prop Trader Reference
Sector Rotation by Macro Cycle Phase — Prop Trader Reference
Macro Strategy: Sector Rotation & Energy Positioning
| Cycle Phase | Leading Sectors | Energy Position | Prop Trader Action |
|---|---|---|---|
| Early-cycle (Recovery) | Small caps, Industrials, Financials | Underweight | Monitor for rotation setup. |
| Mid-cycle (Expansion) | Technology, Comm Services, Materials | Neutral | Begin building entry signals. |
| Late-cycle (Inflation) | Energy, Utilities, Staples, Healthcare | Overweight | Full Rotation Deployment. |
| Recession / Trough | Staples, Quality Large Caps | Reducing | Apply FEFO exits; rotate to defensives. |
Source: CFA Institute Business Cycle Framework; NBER Cycle Definitions; Fidelity Sector Investing Research. For informational purposes only.
When and How to Enter: Signal Framework for Funded Traders
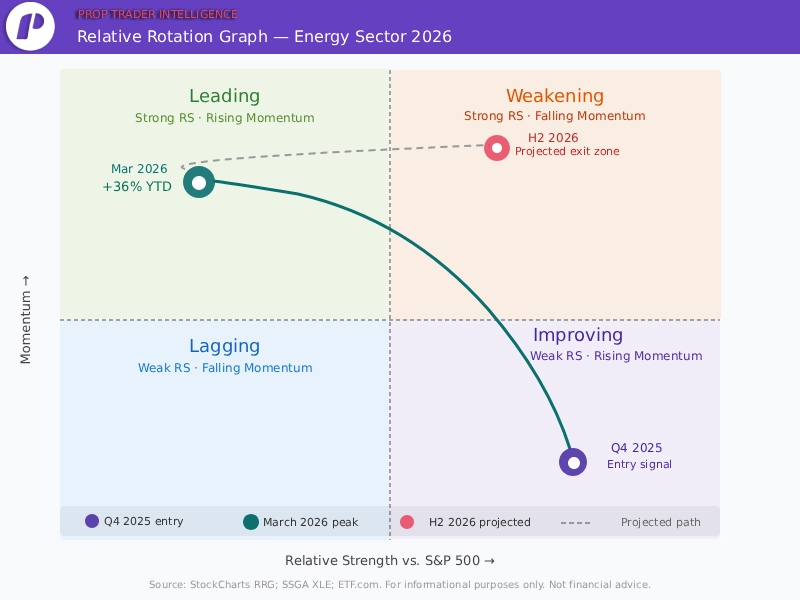
When should you rotate into energy stocks? The answer is a three-signal convergence framework, not a calendar trigger. Prop traders need mechanical entry rules, not opinions, because funded accounts impose consequences for premature or late entries that exceed the daily loss threshold. The three signals are: XLE relative strength versus SPY turning positive on a weekly chart; daily ETF inflow acceleration visible on ETF.com; and the Relative Rotation Graph (RRG) migration from the Improving quadrant into Leading.
How long do stock rotations last? Oil price spikes last a median of 51 days. Business-cycle-driven sector rotations last multiple quarters. The 2026 energy rotation carries both dimensions. Prop traders entering at the early institutional accumulation phase captured the full +36% YTD move; those entering at mainstream confirmation captured a fraction of it, with maximum risk at cycle peak prices.
Relative Rotation Graph — Energy Sector Rotation Path 2026
Prop Trader Entry Signal Checklist — Energy Rotation 2026
Execution Signals: Entry Triggers & Data Reliability
| Signal | Data Source | Lead Time | Prop Trader Action | Reliability |
|---|---|---|---|---|
| XLE Relative Strength (RS) | TradingView/Bloomberg | 2–4 Weeks | Initiate 50% of the planned XLE position. | High |
| ETF Inflow Acceleration | ETF.com / Flow Data | 1–3 Weeks | Add 25% — Institutional confirmation. | High |
| RRG: Improving → Leading | StockCharts RRG | 2–4 Weeks | Add final 25%; set ATR-based stops. | High |
| WTI Breakout + Volume | Bloomberg / CME | 1–2 Weeks | Confirm sector-wide momentum. | Med-High |
| CFTC COT Report | CFTC Weekly | 1–2 Weeks | Secondary confirmation; no standalone action. | Medium |
Source: ETF.com; StockCharts RRG; CFTC Commitments of Traders. For informational purposes only.
The Three Stock Rotation Systems for Finance: FIFO, LIFO, and FEFO
Every trader and investor manages a portfolio that is constantly in motion, positions opening, scaling, and closing as the cycle advances. The question is never just which sector to enter. It is in which order to exit the old ones and in which sequence to build the new ones. FIFO, LIFO, and FEFO provide three distinct frameworks for answering that question. Each one governs a different phase of the rotation cycle and a different type of risk. Prop traders who apply all three in the right sequence hold a structural execution edge over traders who manage positions reactively.
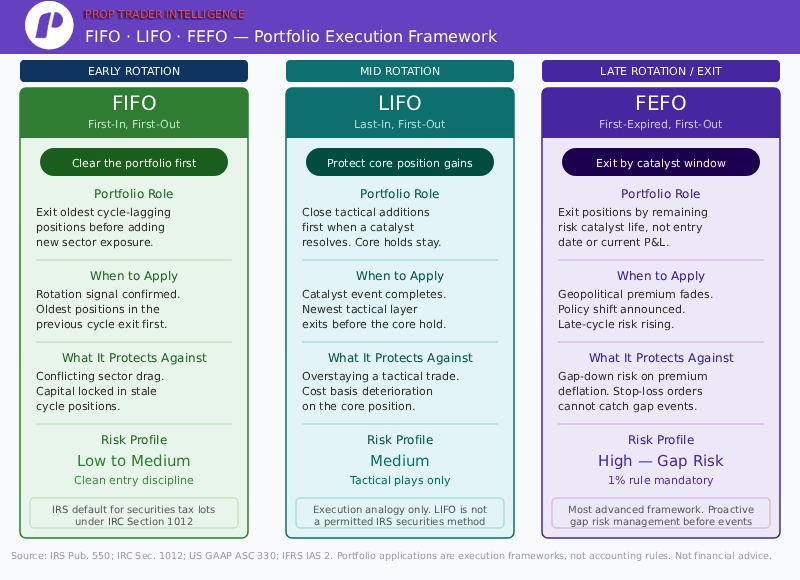
First-In, First-Out (FIFO) — Early Rotation: Clean the Portfolio Before You Build
In portfolio management, FIFO means the oldest positions, the ones accumulated earliest in the previous cycle, are the first to exit when the rotation signal fires. This is not a passive accounting rule. It is an active discipline. An investor entering the 2026 energy rotation carries legacy exposure from the 2024–2025 growth rally: technology overweights, consumer discretionary positions, and growth ETFs that no longer align with the new cycle leadership. FIFO execution means those positions exit first, in order of age, before a single energy name is added.
Why this matters for funded accounts: Holding conflicting sector exposure during a rotation creates a drag that works against the new trade on both sides. The legacy position loses ground as capital rotates out of it; the new energy position is undersized because capital is still locked in the old one. FIFO discipline solves both problems simultaneously. It clears the portfolio of cycle-lagging exposure, frees capital for the incoming rotation, and preserves cost basis clarity on the new positions. For prop traders operating under daily loss limits, a clean portfolio also reduces the number of positions that can gap against the account during a volatile session.
Note: FIFO is also the IRS default for securities tax lot identification under IRC Section 1012 and IRS Publication 550, the earliest-purchased shares are treated as sold first unless the trader elects specific identification.
Last-In, First-Out (LIFO) — Mid Rotation: Protect Gains on Tactical Additions
In portfolio management, LIFO describes a specific execution pattern for prop traders and investors who add tactical positions on top of a core rotation hold. As the energy rotation matures and new catalysts emerge, an OPEC+ surprise, a WTI breakout above a key level, an inventory draw larger than consensus, a prop trader adds a tactical layer to the existing position. When the catalyst resolves or the move exhausts, LIFO execution means that tactical addition, the most recently opened layer, exits first. The core position, built earlier at a lower cost basis and with a larger embedded gain, remains intact.
Why this matters for funded accounts: Tactical additions carry the highest per-share cost and the most time-sensitive risk. They are opened to capture a specific move and should close when that move is complete. Holding them beyond their catalyst window turns a tactical trade into an unintended long-term hold at the worst possible cost basis. LIFO execution enforces the discipline of closing what was opened for a specific reason once that reason is gone, without disturbing the core rotation hold that still has cycle runway remaining.
Note: LIFO, as described here, is a portfolio execution analogy. For US securities, LIFO is not a permitted tax lot identification method under IRS rules. All tax lot decisions must use FIFO or specific identification.
First-Expired, First-Out (FEFO) — Late Rotation: Exit by Risk Window, Not by Entry Date
In portfolio management, FEFO is the most sophisticated of the three frameworks and the most critical for prop traders in volatile energy markets. FEFO does not ask when this position was opened; it asks how much time this position’s risk catalyst has left. The position with the shortest remaining catalyst window exits first, regardless of when it was opened or what its current P&L shows.
In practice, a prop trader holding a portfolio of energy names in mid-2026 holds positions with very different risk profiles. XOM and CVX carry structural, balance-sheet-backed exposure that remains valid as long as the macro cycle supports energy. VLO and MPC carry crack-spread exposure tied to refining margins that can compress quickly. PTEN and AROC carry oilfield services exposure directly tied to upstream capital deployment, which collapses fast when oil drops below the marginal cost threshold. And a tactical XOP position may carry a geopolitical risk premium tied specifically to Strait of Hormuz supply tension.
Applying FEFO Across a Live Energy Portfolio
FEFO execution maps the remaining catalyst life of each position and exits the shortest-window exposure first. When Hormuz tension fades, the geopolitical premium on XOP deflates in hours; that position exits first under FEFO logic, before the structural XOM hold is touched. When OPEC+ announces output additions, upstream services exposure (PTEN, AROC) loses its catalyst faster than midstream income plays (WMB, KMI), FEFO exits the services names first and rotates the released capital into the midstream income layer that retains full-cycle validity.
Why this matters for funded accounts: Energy names can gap 8–12% in a single session when a risk premium deflates rapidly. A stop-loss order does not protect against a gap that opens below the stop level. FEFO logic protects the account by eliminating the highest-gap-risk positions, the ones tied to the most time-sensitive catalysts, before the gap event occurs. It is the only execution framework that addresses gap risk proactively rather than reactively.
Note: FEFO originates in pharmaceutical and perishable food supply chain management, where EU Good Distribution Practice guidelines and FDA food safety standards mandate expiry-date-first sequencing. The portfolio management application described here uses FEFO logic as an analogy for catalyst-window sequencing.
FIFO, LIFO, and FEFO — Portfolio Management Application for Prop Traders
Execution Framework: Portfolio Exit Methods (FIFO, LIFO, FEFO)
| Method | Portfolio Management Role | When to Apply | What It Protects Against | Risk Level |
|---|---|---|---|---|
| FIFO | Clear cycle-lagging positions before building new exposure. | Early Rotation | Conflicting exposure drag; capital lock-up. | Low–Medium |
| LIFO | Exit tactical catalyst additions; protect core cost basis. | Mid Rotation | Overstaying a tactical trade; cost basis deterioration. | Medium |
| FEFO | Exit shortest-catalyst-window first (First-Expiry-First-Out). | Late Rotation | Gap-down risk; premium deflation; end-of-cycle drawdown. | High — Gap Risk |
Source: IRS Publication 550; IRC Section 1012; US GAAP ASC 330; IFRS IAS 2; EU Good Distribution Practice Guidelines; FDA Food Safety Modernization Act. Portfolio management applications are execution frameworks developed from these source methodologies. Not financial advice. All positions carry risk of loss.
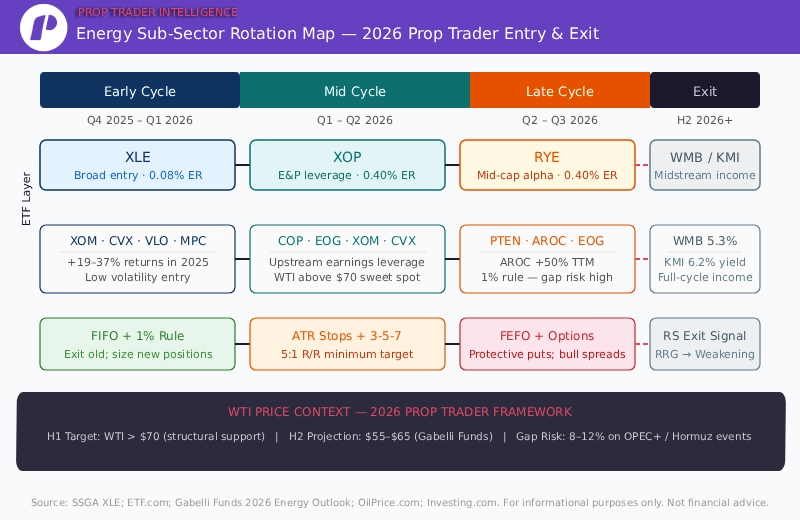
Top Energy Stocks and ETFs for Active Prop Rotation
Rotation Sequence: Large-Cap to Mid-Cap Alpha
The best energy stocks for prop traders depend entirely on the cycle stage at entry. Early-rotation capital flows into large-cap integrateds, XOM, and CVX, because institutional buyers prioritize liquidity and balance-sheet durability at cycle open. Mid-cap names deliver the highest absolute returns in mid-to-late rotation when oil price momentum is fully established, and institutional capital migrates down the capitalization spectrum.
The $70 billion in US upstream assets on the market accelerates M&A-driven re-rating events that compound mid-cap outperformance independently of oil price direction. Prop traders who anchored exclusively to large-cap names systematically missed the mid-cap alpha, the highest return increment in the full 2026 energy cycle.
Energy Sub-Sector Rotation Map — Prop Trader Entry & Exit
Energy Stock Selection by Prop Trader Rotation Stage
Execution Watchlist: Energy Tickers & Prop Trading Parameters
| Stock (Ticker) | Segment | Cycle Stage | Risk | Income/Yield | Prop Trader Note |
|---|---|---|---|---|---|
| ExxonMobil (XOM) | Integrated | Early–Mid | Low–Med | Div 3.4% | Core Position: Max allowed size. |
| Chevron (CVX) | Integrated | Early–Mid | Low–Med | Div 4.1% | Core Position: Dividend floor support. |
| ConocoPhillips (COP) | E&P Upstream | Mid | Medium | Div + Buybacks | Sub-rotate from XLE into COP. |
| Valero (VLO) | Refining | Early | Medium | Div 3.0% | Crack spread play; FEFO exit target. |
| Williams (WMB) | Midstream | Full Cycle | Low | Div 5.3% | H2 2026 rotation target. |
| Kinder Morgan (KMI) | Midstream | Full Cycle | Low | Div 6.2% | Income anchor; H2 rotation. |
| Patterson-UTI (PTEN) | OFS | Mid–Late | High | Minimal | 1% Rule mandatory; Extreme gap risk. |
| Archrock (AROC) | Compression | Mid–Late | High | Div 3.8% | Verify current data; size down. |
Source: SSGA XLE Holdings, March 23, 2026; OilPrice.com; Investing.com. All figures must be independently verified before trading. For informational purposes only.
ETF Rotation Vehicle Comparison — Prop Trader Selection Matrix
ETF Selection: Capital Allocation & Vehicle Characteristics
| ETF | Weighting | Primary Exposure | Exp. Ratio | Yield | Prop Trader: Best For |
|---|---|---|---|---|---|
| XLE | Market-cap | Large integrated oil & gas | 0.08% | 3.20% | Broad rotation entry; Lower gap risk. |
| XOP | Equal-weight | E&P exploration & production | 0.40% | ~2.5% | Mid-cycle: Oil price leverage, ATR stops. |
| VDE | Market-cap | Full energy value chain | 0.10% | ~3.0% | Low-cost diversified exposure. |
| RYE | Equal-weight S&P | Mid-sized S&P 500 energy | 0.40% | ~3.5% | Late-cycle; Mid-cap alpha; strict sizing. |
Source: Investing.com Energy ETF Guide; SSGA XLE Factsheet March 2026; MarketBeat. Expense ratios and yields change — verify with fund providers before trading. For informational purposes only.
Risk Management: The Prop Trader’s Non-Negotiables
The 1% Rule
Active prop traders cap single-position risk at 1% of total funded capital on every energy trade, without exception. XLE can gap 3–6% intraday during geopolitical events; individual energy names can gap significantly higher, bypassing conventional stop-loss orders entirely. The 1% rule compensates for gap risk by reducing position size to the level where the worst-case scenario remains within the funded account’s daily loss limit.
For a $100,000 funded account, the maximum risk per trade is $1,000. Stop distances must be ATR-calculated, not arbitrary round numbers. Over-concentration in energy creates catastrophic drawdown risk from a single OPEC surprise or Hormuz reopening gap that ends funded account eligibility in a single session.
How to Calculate Stock Rotation Rate
How do you calculate stock rotation for a prop trading portfolio? The correct metric for financial markets is the Portfolio Turnover Rate, a standard measure of how actively a portfolio replaces its holdings over a given period.
Portfolio Turnover Rate = (Value of Securities Bought OR Sold ÷ Average Portfolio Value) × 100
The calculation uses whichever is lower, total securities purchased or total securities sold, divided by the average portfolio value over the measurement period, expressed as a percentage. A 100% turnover rate means the entire portfolio was replaced once within the period. A rate above 100% indicates multiple full rotations within the same period; common in active prop trading programs during high-conviction sector rotation cycles.
Why This Matters For Prop Traders:
A high portfolio turnover rate signals active rotation discipline; capital is moving from cycle-lagging sectors into cycle-leading ones at the pace the market demands. A low turnover rate in a high-velocity rotation environment like Q1 2026 energy signals the opposite: the trader is holding stale exposure while institutional capital has already repositioned. For funded accounts with daily loss limits, monitoring turnover rate also flags over-trading risk, excessive rotation driven by noise rather than signal increases transaction costs and erodes the edge that mechanical rotation frameworks are designed to capture.
Practical Example:
A prop trader with a $100,000 funded account who buys $60,000 in energy ETFs and sells $55,000 in technology positions over a quarter calculates turnover as: $55,000 ÷ $100,000 × 100 = 55% quarterly turnover, indicating active but controlled rotation aligned with a single macro cycle shift.
Source: CFA Institute — Portfolio Turnover Definition; SEC Form N-1A (mutual fund turnover disclosure standard); Investopedia Portfolio Turnover. For informational purposes only. Not financial advice.
The 3-5-7 Rule
The 3-5-7 rule provides a practical sizing and reward framework: risk no more than 3% of total capital across all open energy trades simultaneously; target a minimum 5:1 reward-to-risk ratio on each individual position; and accept that 7 of 10 trades in volatile energy cycles will require active management before reaching full targets.
How often should stock rotation be done? For prop traders, rotation review occurs on a fixed schedule: weekly RRG analysis every Friday close, daily ETF flow monitoring, and intraday review when WTI trades through a key technical level. The 80/20 rule applies directly, 80% of rotation alpha comes from 20% of the entry signals.
Options Overlays for Prop Account Protection
Options strategies provide a second protection layer that standard stop-losses cannot deliver in gap-risk environments. Bull call spreads on XLE or XOP limit net premium paid while maintaining full upside participation. Protective puts on XLE purchased before Federal Reserve decisions or OPEC+ meetings provide a defined floor against scenarios that bypass stop orders entirely. For range-bound sub-sectors with declining implied volatility, iron condors generate premium income while the core rotation position matures.
Exit Framework: When to Rotate Out of Energy
When should you rotate stock out of energy? The exit layer is as mechanical as the entry layer. Prop traders who wait for price confirmation of the exit signal, rather than relative strength confirmation, systematically overstay cycle peaks and surrender gains accumulated over multiple months in a single drawdown session. The RRG transition from Leading into Weakening typically precedes price decline by two to four weeks.
Energy Rotation Exit Signal Framework for Prop Traders
Exit Strategy: Sector Sell Signals & Prioritization
| Exit Signal | What It Indicates | Prop Trader Response | Priority |
|---|---|---|---|
| XLE RS vs. SPY turns negative | Sector losing relative leadership (weekly). | Reduce broad ETF exposure by 50%. | Critical |
| WTI breaks below $60 support | Supply-demand balance deteriorating. | Exit all high-beta E&P and services names. | Critical |
| RRG: Leading → Weakening | Momentum peak confirmed ahead of price. | Tighten stops; begin reducing mid-caps. | High |
| ETF outflow acceleration | The institutional distribution phase is active. | Exit highest-gap-risk names first. | High |
| OPEC+ output additions | Supply ceiling removes risk premium. | Apply FEFO: exit geopolitical positions first. | High |
| Seasonal September pressure | Historically weakest month; loss harvesting. | Reduce high-beta exposure; tighten stops. | High |
| Earnings guidance cuts begin | Earnings cycle peak confirmed. | Rotate into WMB/KMI midstream income. | Medium |
Source: StockCharts RRG; ETF.com daily flow data; Gabelli Funds 2026 Energy Outlook; NBER Seasonal Equity Research. For informational purposes only.
JP Morgan’s 2026 energy outlook projects sector profit improvement in Q1 and Q2, followed by H2 normalization as supply additions pressure crude toward the lower end of the $55–$65 WTI projection. Gabelli Funds projects a 2.3 million barrel per day oversupply entering H2. The natural gas and LNG sub-sector diverges positively from crude, creating the next rotation layer within energy as the oil price cycle completes its current phase.
Conclusion: The Prop Trader’s 2026 Energy Rotation Playbook
Effective stock rotation is not a market prediction. It is a repeatable system for ensuring that capital is always allocated to the sector with the strongest relative earnings momentum, the clearest institutional support, and the most favorable position in the current business cycle phase. The energy rotation of 2026 is one application of that system. The framework itself applies across every cycle, every sector, and every market environment.
Four principles define the executable foundation for any serious rotation strategy.
- Apply a multi-signal entry framework combining relative strength, institutional ETF flows, and RRG confirmation to enter ahead of price confirmation rather than chasing moves already in progress. Layer seasonal calendar patterns as secondary confirmation to improve timing precision.
- Use FIFO sequencing to clear cycle-lagging positions before building new sector exposure. A portfolio carrying conflicting sector weights cannot execute a clean rotation regardless of how accurate the macro thesis is.
- Apply LIFO execution to tactical catalyst additions, exiting the most recently opened layer when the catalyst resolves while protecting the core position’s cost basis and cycle runway.
- Use FEFO logic for late-cycle and geopolitical-risk exits, sequencing out of positions by remaining catalyst window rather than by entry date or current P&L.
What does stock rotation ensure for an active investor or trader? It ensures that capital follows cycle leadership with mechanical precision rather than conviction, headlines, or hope. The traders and portfolio managers who master the full lifecycle, entry sequencing, sub-rotation timing, and structured exit discipline hold a durable edge over every reactive participant across every rotation cycle the market produces.
Sources
- Wikipedia — Stock Rotation: https://en.wikipedia.org/wiki/Stock_rotation
- ShipBob — Stock Rotation Guide: https://www.shipbob.com/blog/stock-rotation/
- Holded — How to Calculate Stock Rotation: https://www.holded.com/blog/stock-rotation-what-is-it-and-how-to-calculate
- The Access Group — Guide to Stock Rotation: https://www.theaccessgroup.com/en-au/erp/software/warehouse-management-system/guide-to-stock-rotation/
- Exptrac — Stock Rotation Services: https://exptrac.com/blog/stock-rotation-services/
- Balloon One — Master Stock Rotation: https://balloonone.com/blog/master-stock-rotation-better-inventory-management/
- Flow.space — Stock Rotation: https://flow.space/blog/stock-rotation
- SSGA — XLE Factsheet March 2026: https://www.ssga.com/us/en/individual/etfs/funds/energy-select-sector-spdr-fund-xle
- Gabelli Funds — 2026 Energy Outlook: https://www.gabelli.com
- ETF.com — Energy ETF Flow Data: https://www.etf.com
- CME Group — WTI Crude Oil Futures: https://www.cmegroup.com
- JP Morgan — 2026 Energy Sector Outlook: https://www.jpmorgan.com/insights
- UNH Extension — Importance of Stock Rotation: https://extension.unh.edu/blog/2025/08/importance-stock-rotation
- IRS Publication 550 — Investment Income and Expenses: https://www.irs.gov/publications/p550
- CFA Institute — Business Cycle and Sector Rotation: https://www.cfainstitute.org
- NBER — Business Cycle Dating: https://www.nber.org/research/business-cycle-dating
Disclaimer: This document is for informational and educational purposes only. It does not constitute financial, investment, or trading advice. Past performance is not indicative of future results. All referenced data points, analyst projections, and third-party research should be independently verified before acting on any information contained herein. Trading involves substantial risk of loss.
If you liked this post make sure to share it!