Introduction
Stock traders who use technical analysis as the foundation of their strategies have a huge wealth of patterns to choose from to help them predict future price movements. Amongst them, a powerful – yet often ignored pattern – is the Broadening Formation Pattern (aka “a megaphone pattern” or an “inverted triangle”).
The Broadening Formation Pattern can often be both intriguing and intimidating due to its high volatility, unique structure, and the chaotic market sentiments that it reflects.
In today’s article, we’ll find out and learn what the broadening formation pattern is, how to recognize it, and how it can be traded.
Let’s dive in!
What is the Broadening Formation Pattern?
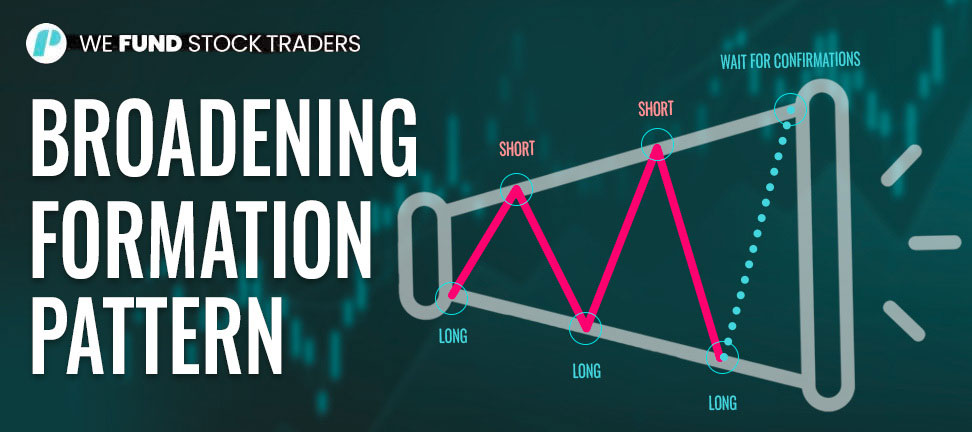
The Broadening Formation Pattern is a chart pattern marked by growing market volatility and a series of higher highs and lower lows that -when joined by trendlines, seem to form a broadening shape that looks a bit like a megaphone.
Unlike patterns such as triangles or wedges – which are somewhat more symmetric – the broadening formation shows a market that is becoming more unpredictable and less stable.
The Broadening Formation Pattern can easily appear in both upward and downward trends and can often signal uncertainty and market instability before a possible reversal or continuation.
Recognizing a Broadening Formation Pattern
To spot a broadening formation pattern on your charts, you need to see at least three of its key elements:
Higher highs and lower lows, a broadening shape, and a longer time frame.
Higher Highs and Lower Lows
Look out for a sequence of peaks and troughs where each successive high is higher than the previous one, and each successive low is lower than the last.
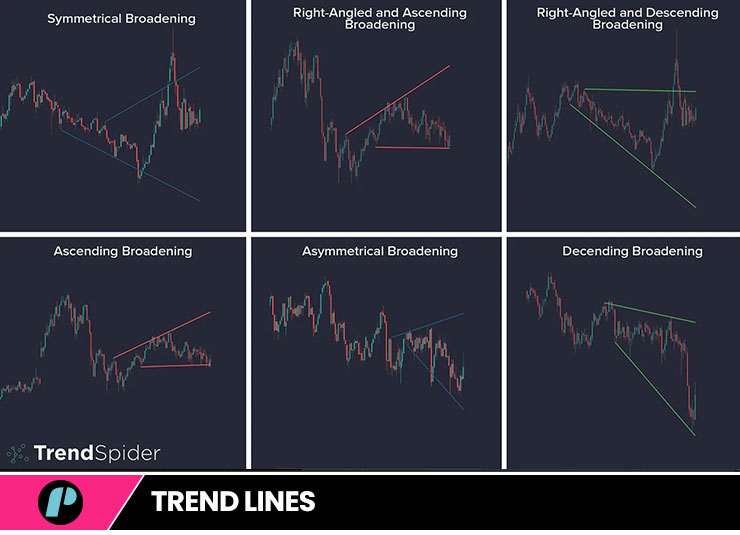
Trend Lines
Draw two trend lines across the highs and the lows respectively so that they create a broadening shape.
Time Frame
Broadening formations can show up on any timeframe but they are considered to be more accurate when appearing in longer time frames, like the daily or weekly charts (which make it perfect for swing trading!)
What’s behind the Broadening Formation Pattern?
The expanding formation pattern shows a market going through big emotional changes. Investors are unsure about where the market will go next which leads to high volatility without a convincing trend direction. This uncertainty can be driven by various factors including economic reports, geopolitical events, or significant corporate news
While sellers push prices down to new lows, buyers push prices up to new highs. It’s no wonder this results in a dubious expanding pattern.
Trading the Expanding Formation
Because of its inherent volatility and unpredictability, trading the broadening formation pattern can be challenging but, with a strategic approach and as part of a complete trading strategy, it can offer traders great opportunities and returns.
There are two main strategies when it comes to trading the Expanding Formation: the Breakout strategy and “Swinging within the Pattern”.
Let’s take a look.
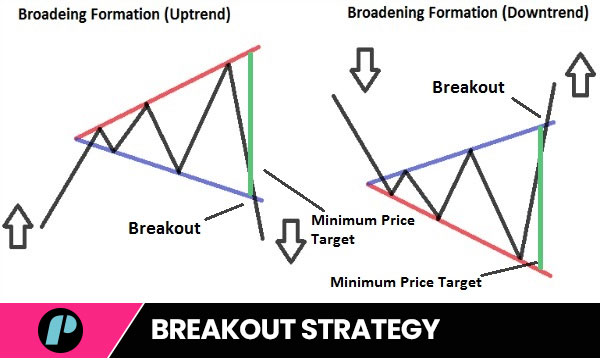
The Breakout Strategy
One of the most common strategies is (as you will have guessed by its name) to wait for a breakout from the pattern and then open the corresponding position.
Here’s how it is normally done:
Confirmation:
Wait for the price to break decisively above the upper trend line (in the case of a bullish breakout) or below the lower trend line (in the case of a bearish breakout).
Volume:
Confirm the breakout with increasing volume.
A true breakout is – more often than not – accompanied by a surge in trading volume.
Entry:
Enter the trade after a successful test of the broken trend line.
If the price breaks above and then tests the upper trend line again, it’s a signal to open a long position. If the price breaks below and tests the lower trend line again, it’s a signal to go short.
Stop Loss:
Set a stop loss just under the breakout point for your long positions and just over the breakout point for your short ones. This would protect you against fake breakouts.
Profit Target:
Set your profit target using the pattern’s height.
Calculate the distance from the highest high to the lowest lows of the pattern and extend that distance from the breakout point to set your take profit.
Example of trading a Bullish Breakout
Let’s say you spotted a widening formation on the daily chart of a stock X.
That stock price has created a series of higher highs at $150, $160, and $170 and lower lows at $140, $130, and $120. Draw your trend lines and wait for a breakout.
Finally, the stock breaks above the upper trend line at $170 with strong volume. Wait for a retest of the $170 level, which occurs, confirming the breakout. Enter a long trade at $170, place a stop loss at $165, and set a profit target at $190 (projecting the $20 range of the pattern from the breakout point).
Swing Trading Within the Pattern
This other strategy focuses on profiting from the price swings within the Broadening Formation Pattern taking advantage of the highs and the lows that characterize the pattern. This is how it works:
Identify the Swings:
Look for the most likely reversal points at the upper and lower trend lines.
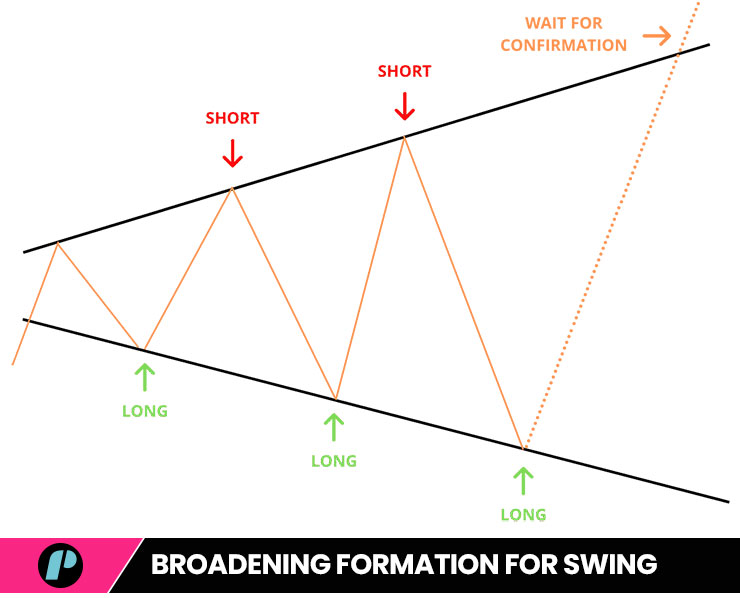
Entry Points:
Enter long trades near the lower trend line and short trades near the upper trend line.
Stop Loss:
Set tight stop losses past the trend lines to reduce risk.
Profit Targets:
Set your take profit at or near the opposite trend line.
Example of Swing Trading Within a Broadening Formation
Using the same stock X example, let’s say price is now near the lower trend line at $120. Enter a long trade with a stop loss at $115 and the take profit at $170.
The stock moves back up towards the upper trend line at $170. Close your position at $170, capturing a significant profit.
Now, wait until price falls past the $170 trend line and when it does, open a short position.
Cash in and repeat.
Potential Risks and extra tips
Whatever your trading skills level, you sure don’t need us to remind you that no trading strategy is perfect on its own and that they all present some kind of risks, defects, and pitfalls. But, just to be on the safe side, let us remind you anyway.
This, in particular, is what you need to consider when trading the Broadening Formation Pattern:
False Breakouts:
Broadening formations are infamous for false breakouts due to their volatility. Always wait for confirmation and a retest to enter a trade.
Wider Stop Losses:
The Broadening Formation Pattern’s inherent volatility requires you to use a wider stop loss which can increase your risk. Balance your position size accordingly and with caution.
Market Context:
The overall market context is extremely important. Broadening formations during high volatility periods may behave differently compared to stable periods. Always consider and include the market context as part of your analysis.
Patience:
Patience is key.
Wait for clear signals and avoid over-trading when price movements are too erratic.

Conclusion
As you’ll realize even better while using it, the Broadening Formation Pattern provides a unique method to understand and trade market volatility. By understanding its structure and the market psychology behind it, you could realize some impressive gains and add another pattern to your arsenal.
But remember to always keep on top of your risk management, maintain discipline and use other indicators to confirm your trading ideas.
Well. that’s all for today, Traders.
Hope this helps.
If you liked this post make sure to share it!